It’s 8:11 AM Wednesday and I’m staring at a $4,312 Anthropic bill for the prior week. Same workload as the week before, when the bill was $1,108. Nothing in my product code changed. Nothing in the cron schedule changed. The morning briefing still ran at 6:30, the friday-wrapup still fired at 5 PM, the deal-advancement alert still woke up at 4:02 AM Eastern. The numbers were just different by almost 4x.
I spent forty minutes thinking my workers had gone feral and were re-running themselves in some loop I couldn’t see. They hadn’t. The cron logs were clean. The token counts on each individual run looked roughly normal. The only thing that looked off was the ratio of cached input tokens to fresh input tokens — which had cratered.
The thing that changed was a 38-line edit to my
Prompt caching isn’t a feature you turn on. It’s a contract about what changes between calls, and one paragraph of edits voided the contract.
The fix took 12 minutes. I moved the new section to the bottom of CLAUDE.md, behind the cache breakpoint. The bill went back to $1,108 the following week.
The four costs nobody draws on the same chart#
When you look at the Anthropic pricing page you see a per-million-token rate for input and output. That’s two numbers. The actual bill has four.
- Input tokens — what you send. The system prompt, the user message, prior turns, tool definitions.
- Output tokens — what the model writes back. Almost always 5x the input price.
- Cache write tokens — the first time a prefix is cached, you pay a 25% premium over the input rate. One-time cost.
- Cache read tokens — every subsequent call that hits the same prefix pays roughly 10% of the input rate. Ten times cheaper.
The 10x gap between cache read and full input is the entire game. Every operator-grade Claude workload I run leans on it. A morning briefing that pulls in 40K tokens of portfolio context, MCP tool schemas, and prior week’s running summary should pay full price for 40K tokens exactly once a week. The other six mornings, that prefix should be a cache hit costing roughly a tenth of that.
When the cache works you don’t think about it. When it breaks you don’t see it on the per-call view, you see it on the weekly invoice, which is where I learned this lesson the expensive way.
Stable prefixes, and what voids the contract#
Here’s the operator’s model of how prompt caching works. The Anthropic SDK lets you mark a point in your prompt with a cache_control breakpoint:
response = client.messages.create(
    model="claude-sonnet-4-5",
    max_tokens=2048,
    system=[
        {
            "type": "text",
            "text": LARGE_SYSTEM_PROMPT,  # 40K tokens of context
            "cache_control": {"type": "ephemeral"}
        }
    ],
    messages=[{"role": "user", "content": user_message}]
)
That cache_control block draws a line. Everything before it is the cached prefix. The first call writes the prefix to a server-side cache keyed by the exact byte content. The next call within ~5 minutes that sends the same bytes pays the cheap cache-read rate for that section, and full price only for what comes after.
What voids the contract:
- Editing any byte before the breakpoint. Even a typo fix. Cache miss.
- Reordering paragraphs in your system prompt. Same.
- Adding new context at the top instead of the bottom. Same.
- Letting the cache go cold (no requests for 5+ minutes on the ephemeral tier). Cache evicted.
- Switching models mid-flight. Each model has its own cache.
The mental fix is: treat your system prompt like an append-only log. New stuff goes at the end. The old stuff stays exactly as it was, even if you’d rather rewrite it. Your invoice will thank you.
Reading the caching scorecard#
The two sections above tell you how caching works and what voids it. This one tells you how to know, without waiting for the invoice, whether yours is actually working. The Anthropic console has a Caching tab. Most operators have never opened it. Open it weekly. Two numbers decide whether you’re winning.
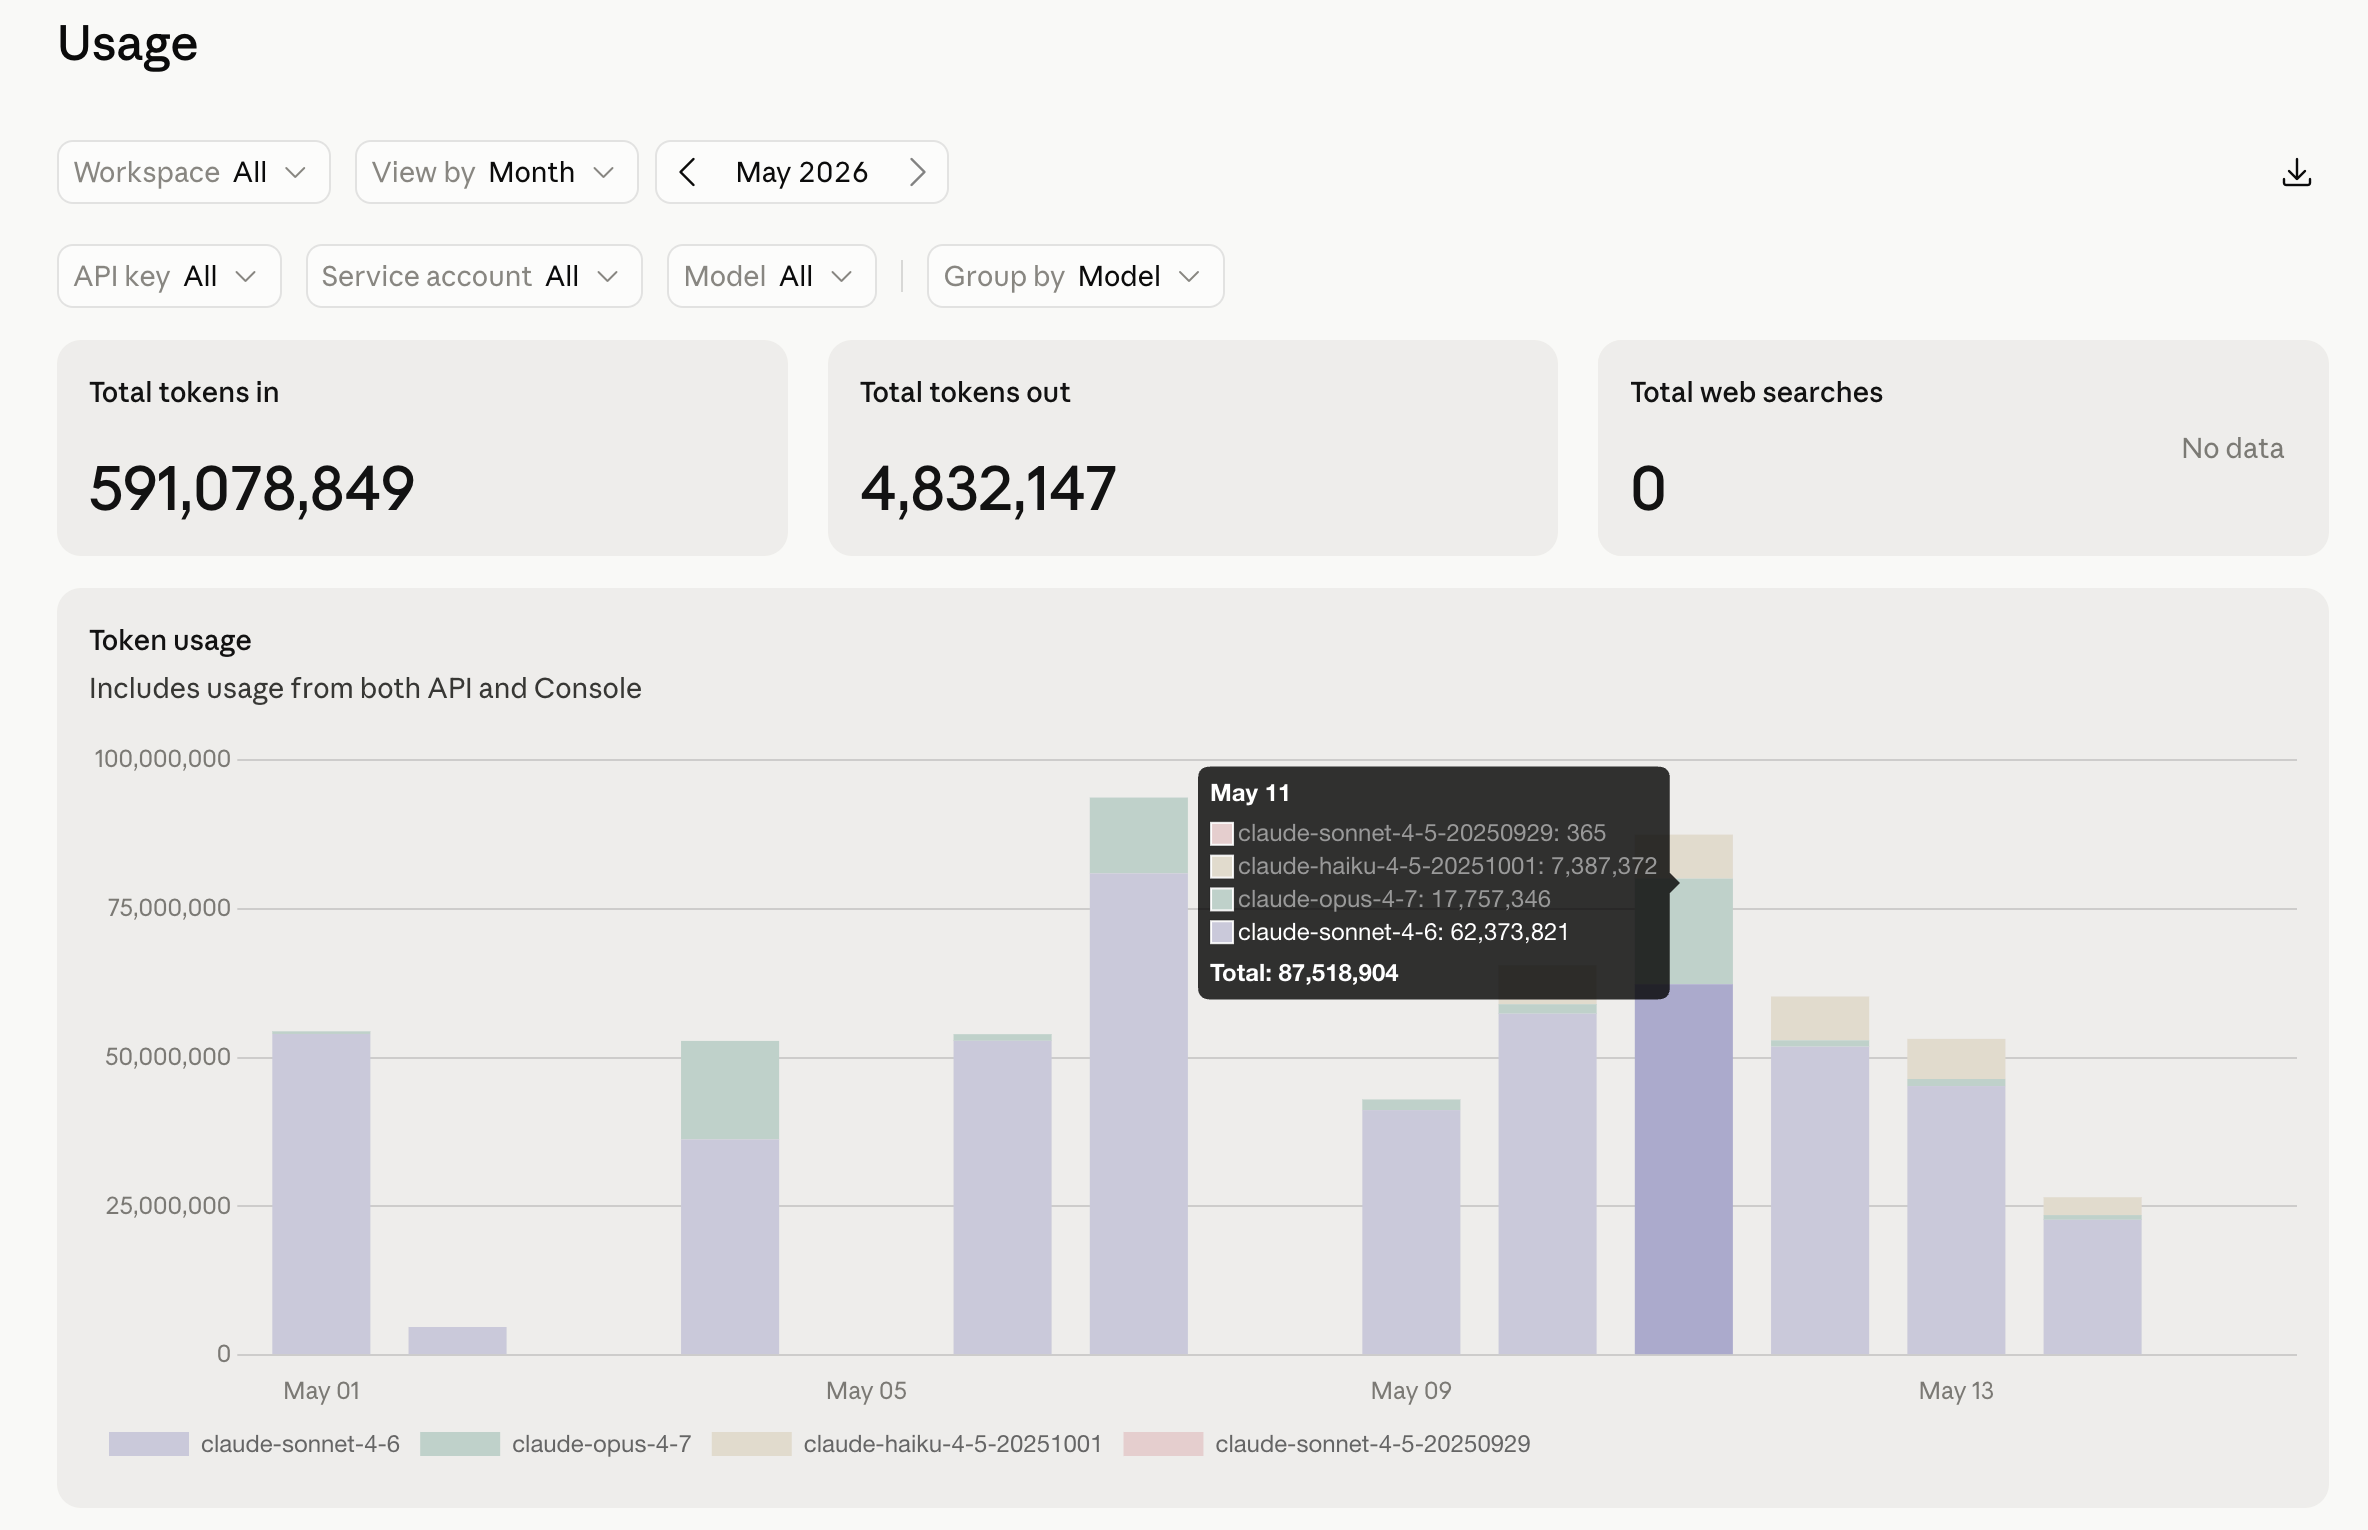
Cache read ratio. Of every input token you sent, what fraction was a cheap cache read versus a full-price fresh or write token. This is the single number that would have caught my $4,312 week on the Tuesday instead of the following Monday. Mine over the last seven days: 98.1%. The target isn’t a figure I invented — anything north of ~90% means your prefixes are stable and the contract from the last section is holding. Below ~80% means you’re voiding it somewhere and don’t know it yet. Watch the chart, not just the number: there’s one sharp dip in mine around May 11. That dip is a cache-voiding event with a timestamp on it. You can trace it to the commit. That is the early-warning system the cold open of this chapter didn’t have.
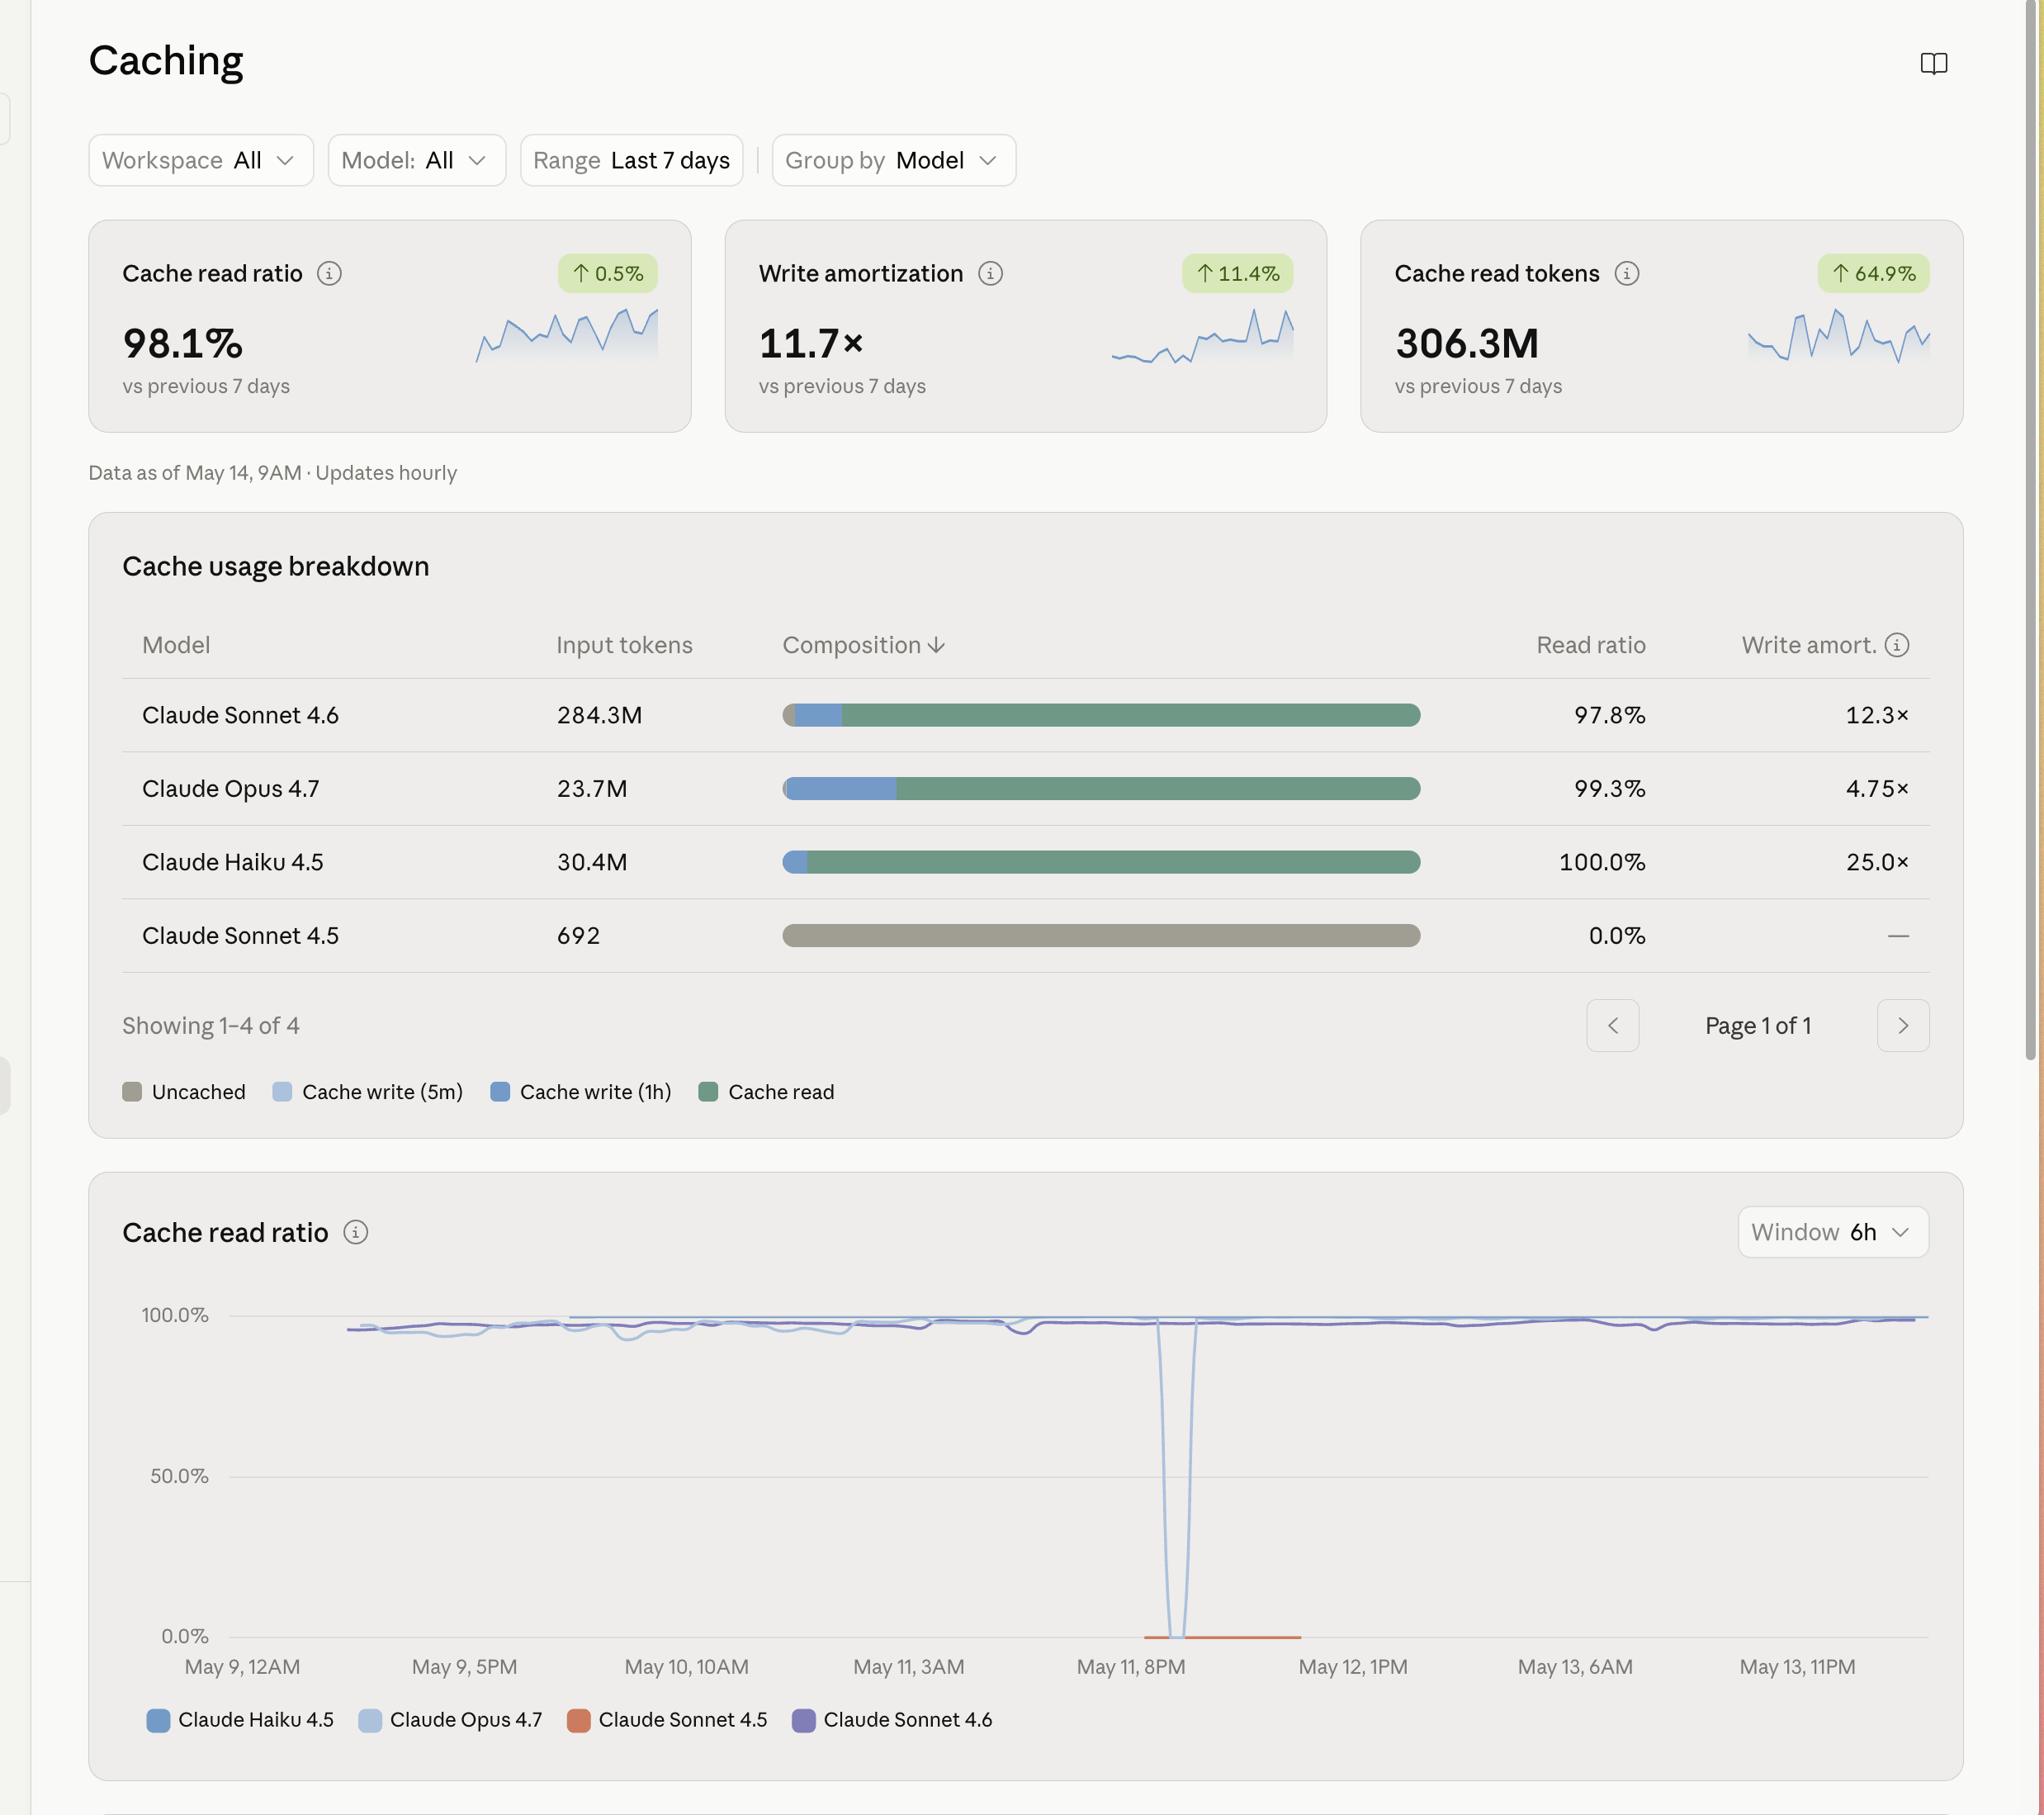
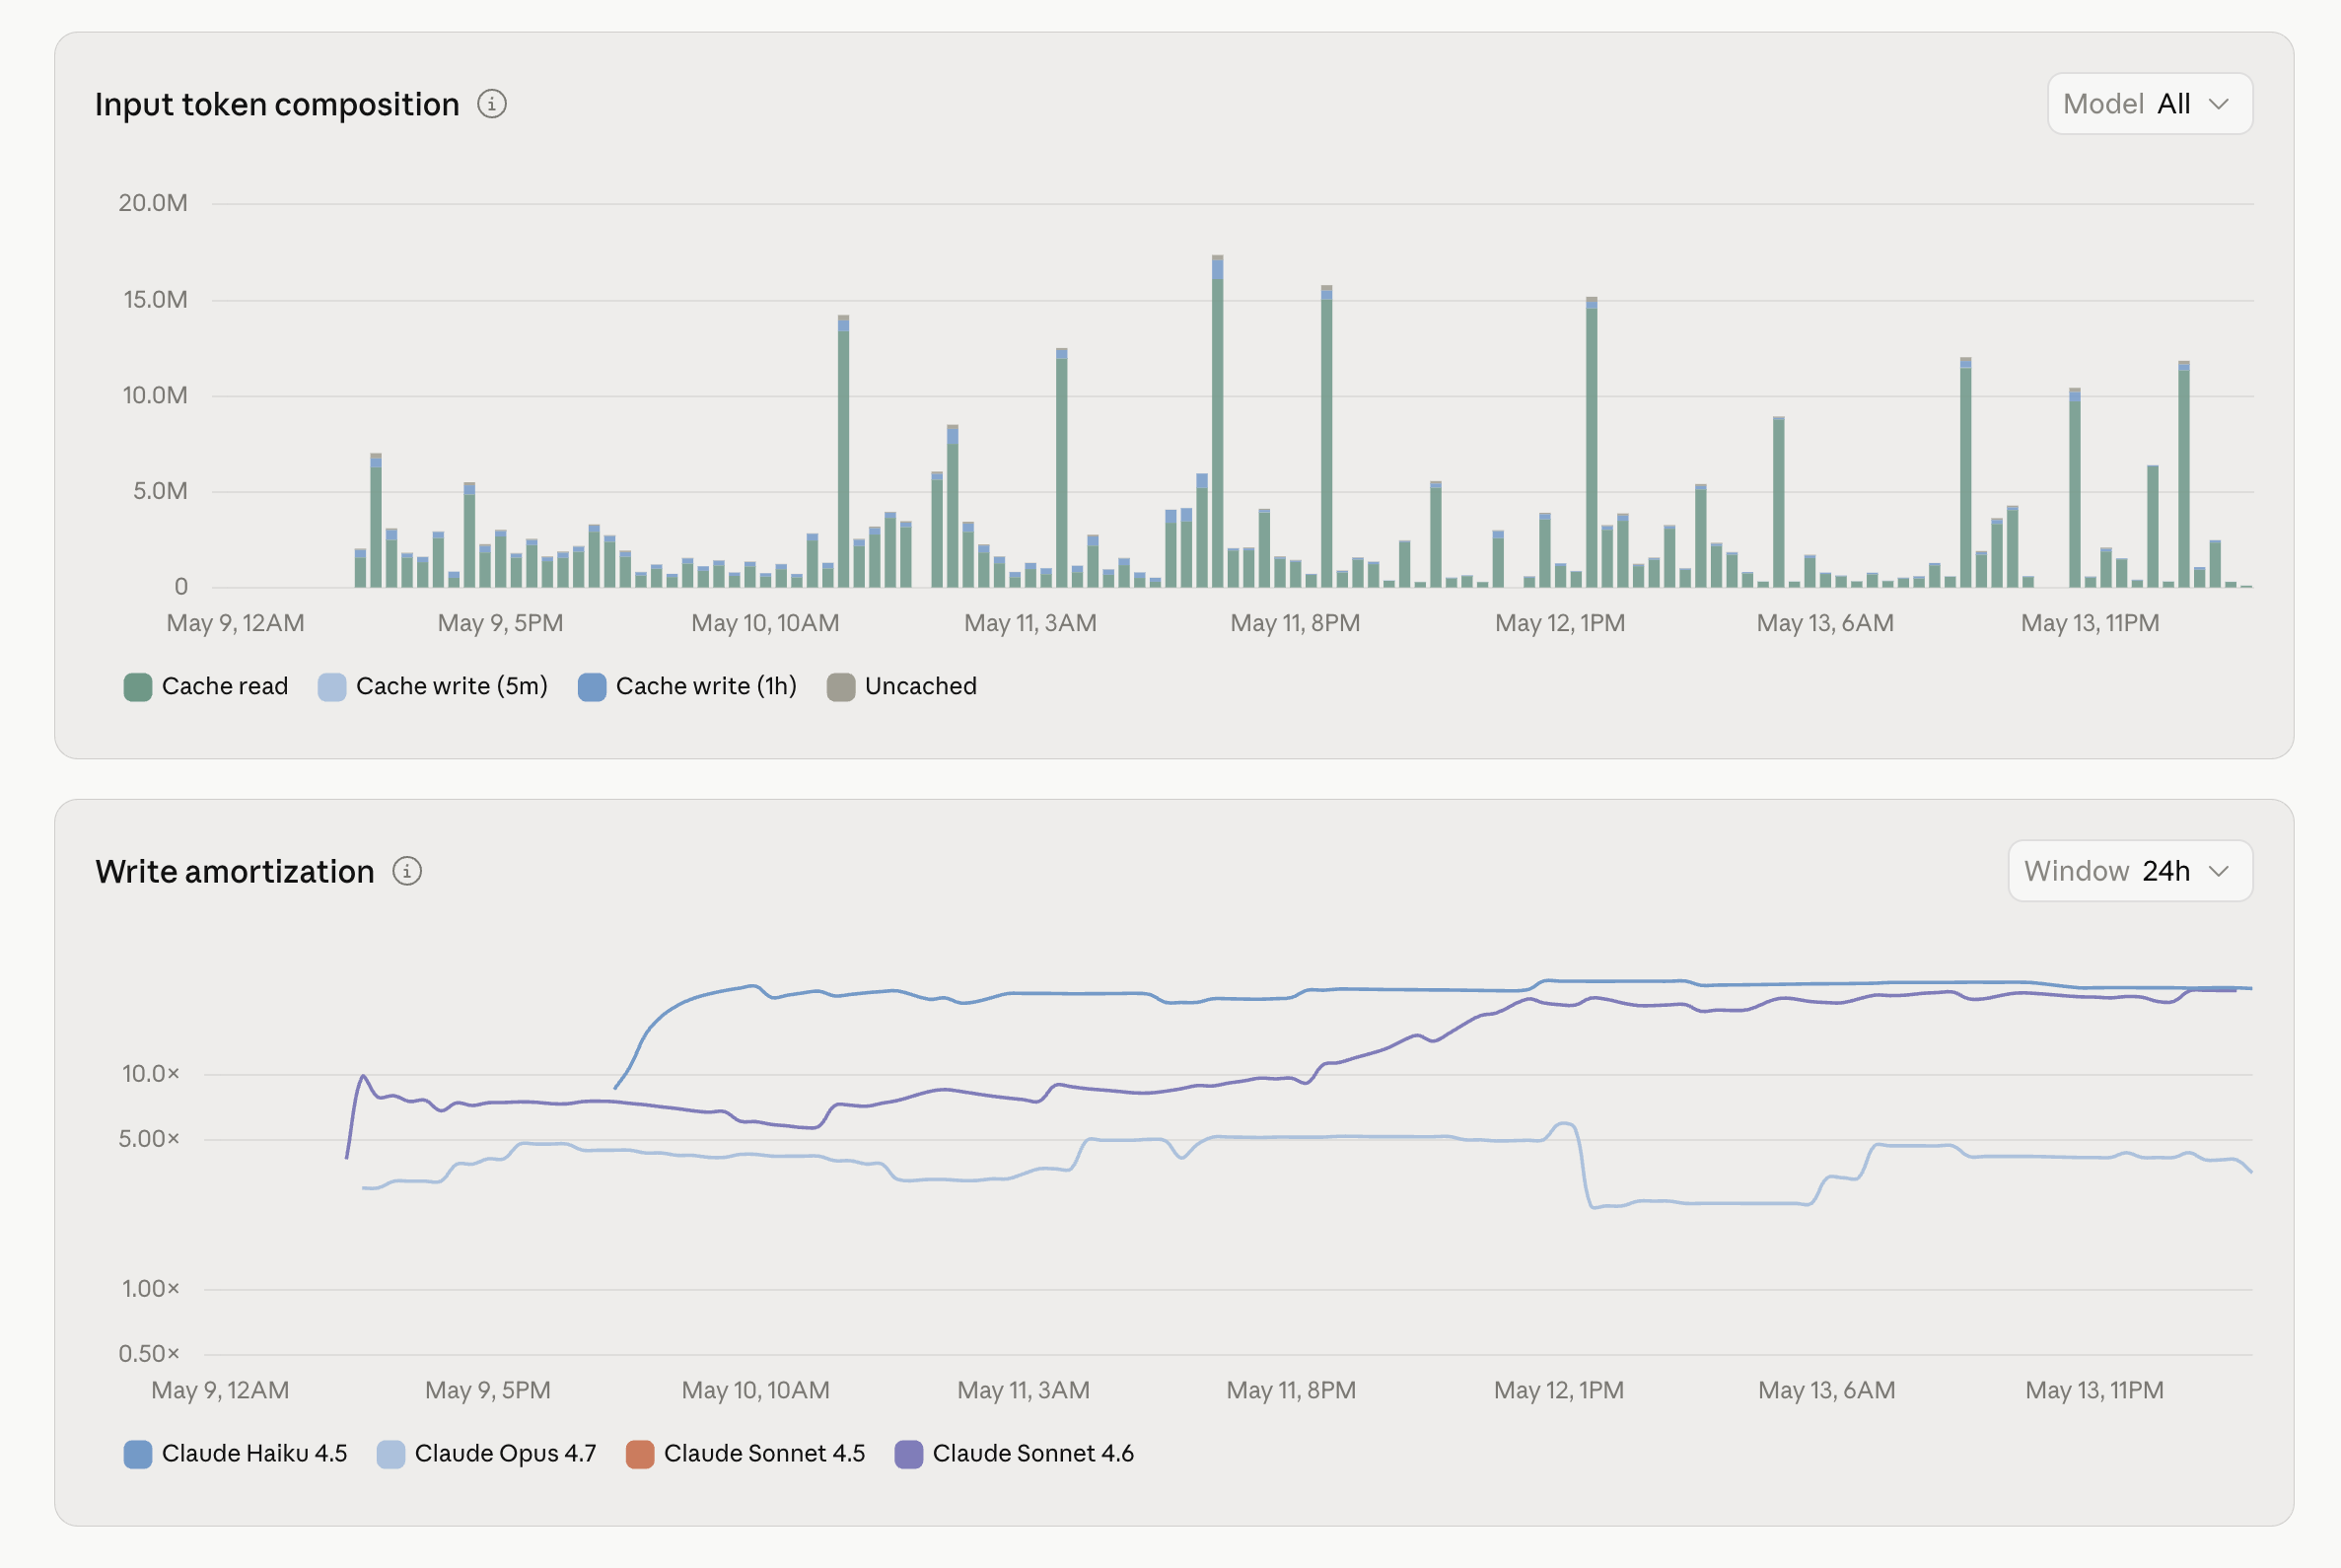
Write amortization. How many times you read a cached prefix for each time you paid to write it. This is the number nobody talks about, and it’s the one that actually moves the bill. A cache write costs 1.25× the base input rate — a 25% premium. A cache read costs 0.1×. So if you write a prefix and read it back exactly once, your “discount” is a 35% surcharge wearing a discount’s clothes — you paid the premium and barely used it. The math only works on repetition. Mine, blended: 11.7×. Per model it splits the way the work splits:
- Haiku 4.5 — 25.0×, 100% read ratio. Textbook. High-frequency triage hitting the identical prefix hundreds of times. This is what caching is for.
- Sonnet 4.6 — 12.3×, 97.8%, 284M tokens. Carries the volume, and it’s healthy. The bulk of the operation lives here.
- Opus 4.7 — 4.75×, 99.3%. The watch line. Opus runs are rarer and spikier, so each cached prefix amortizes fewer times. That is fine if Opus is genuinely your “only when you actually need it” tier — and it is, see the routing section below. It is a red flag if Opus is quietly running routine work that belonged on Sonnet.
The blended math, concretely: at 11.7× the cached portion of a prefix costs roughly (1.25 + 11.7 × 0.1) / 12.7 ≈ 0.19× the base input rate — an ~81% discount on the part of every prompt that never changes. At Haiku’s 25× it is ~86% off. At a 1× “amortization” it is a ~35% markup. Same feature, opposite sign, and the only variable is whether you reuse the prefix.
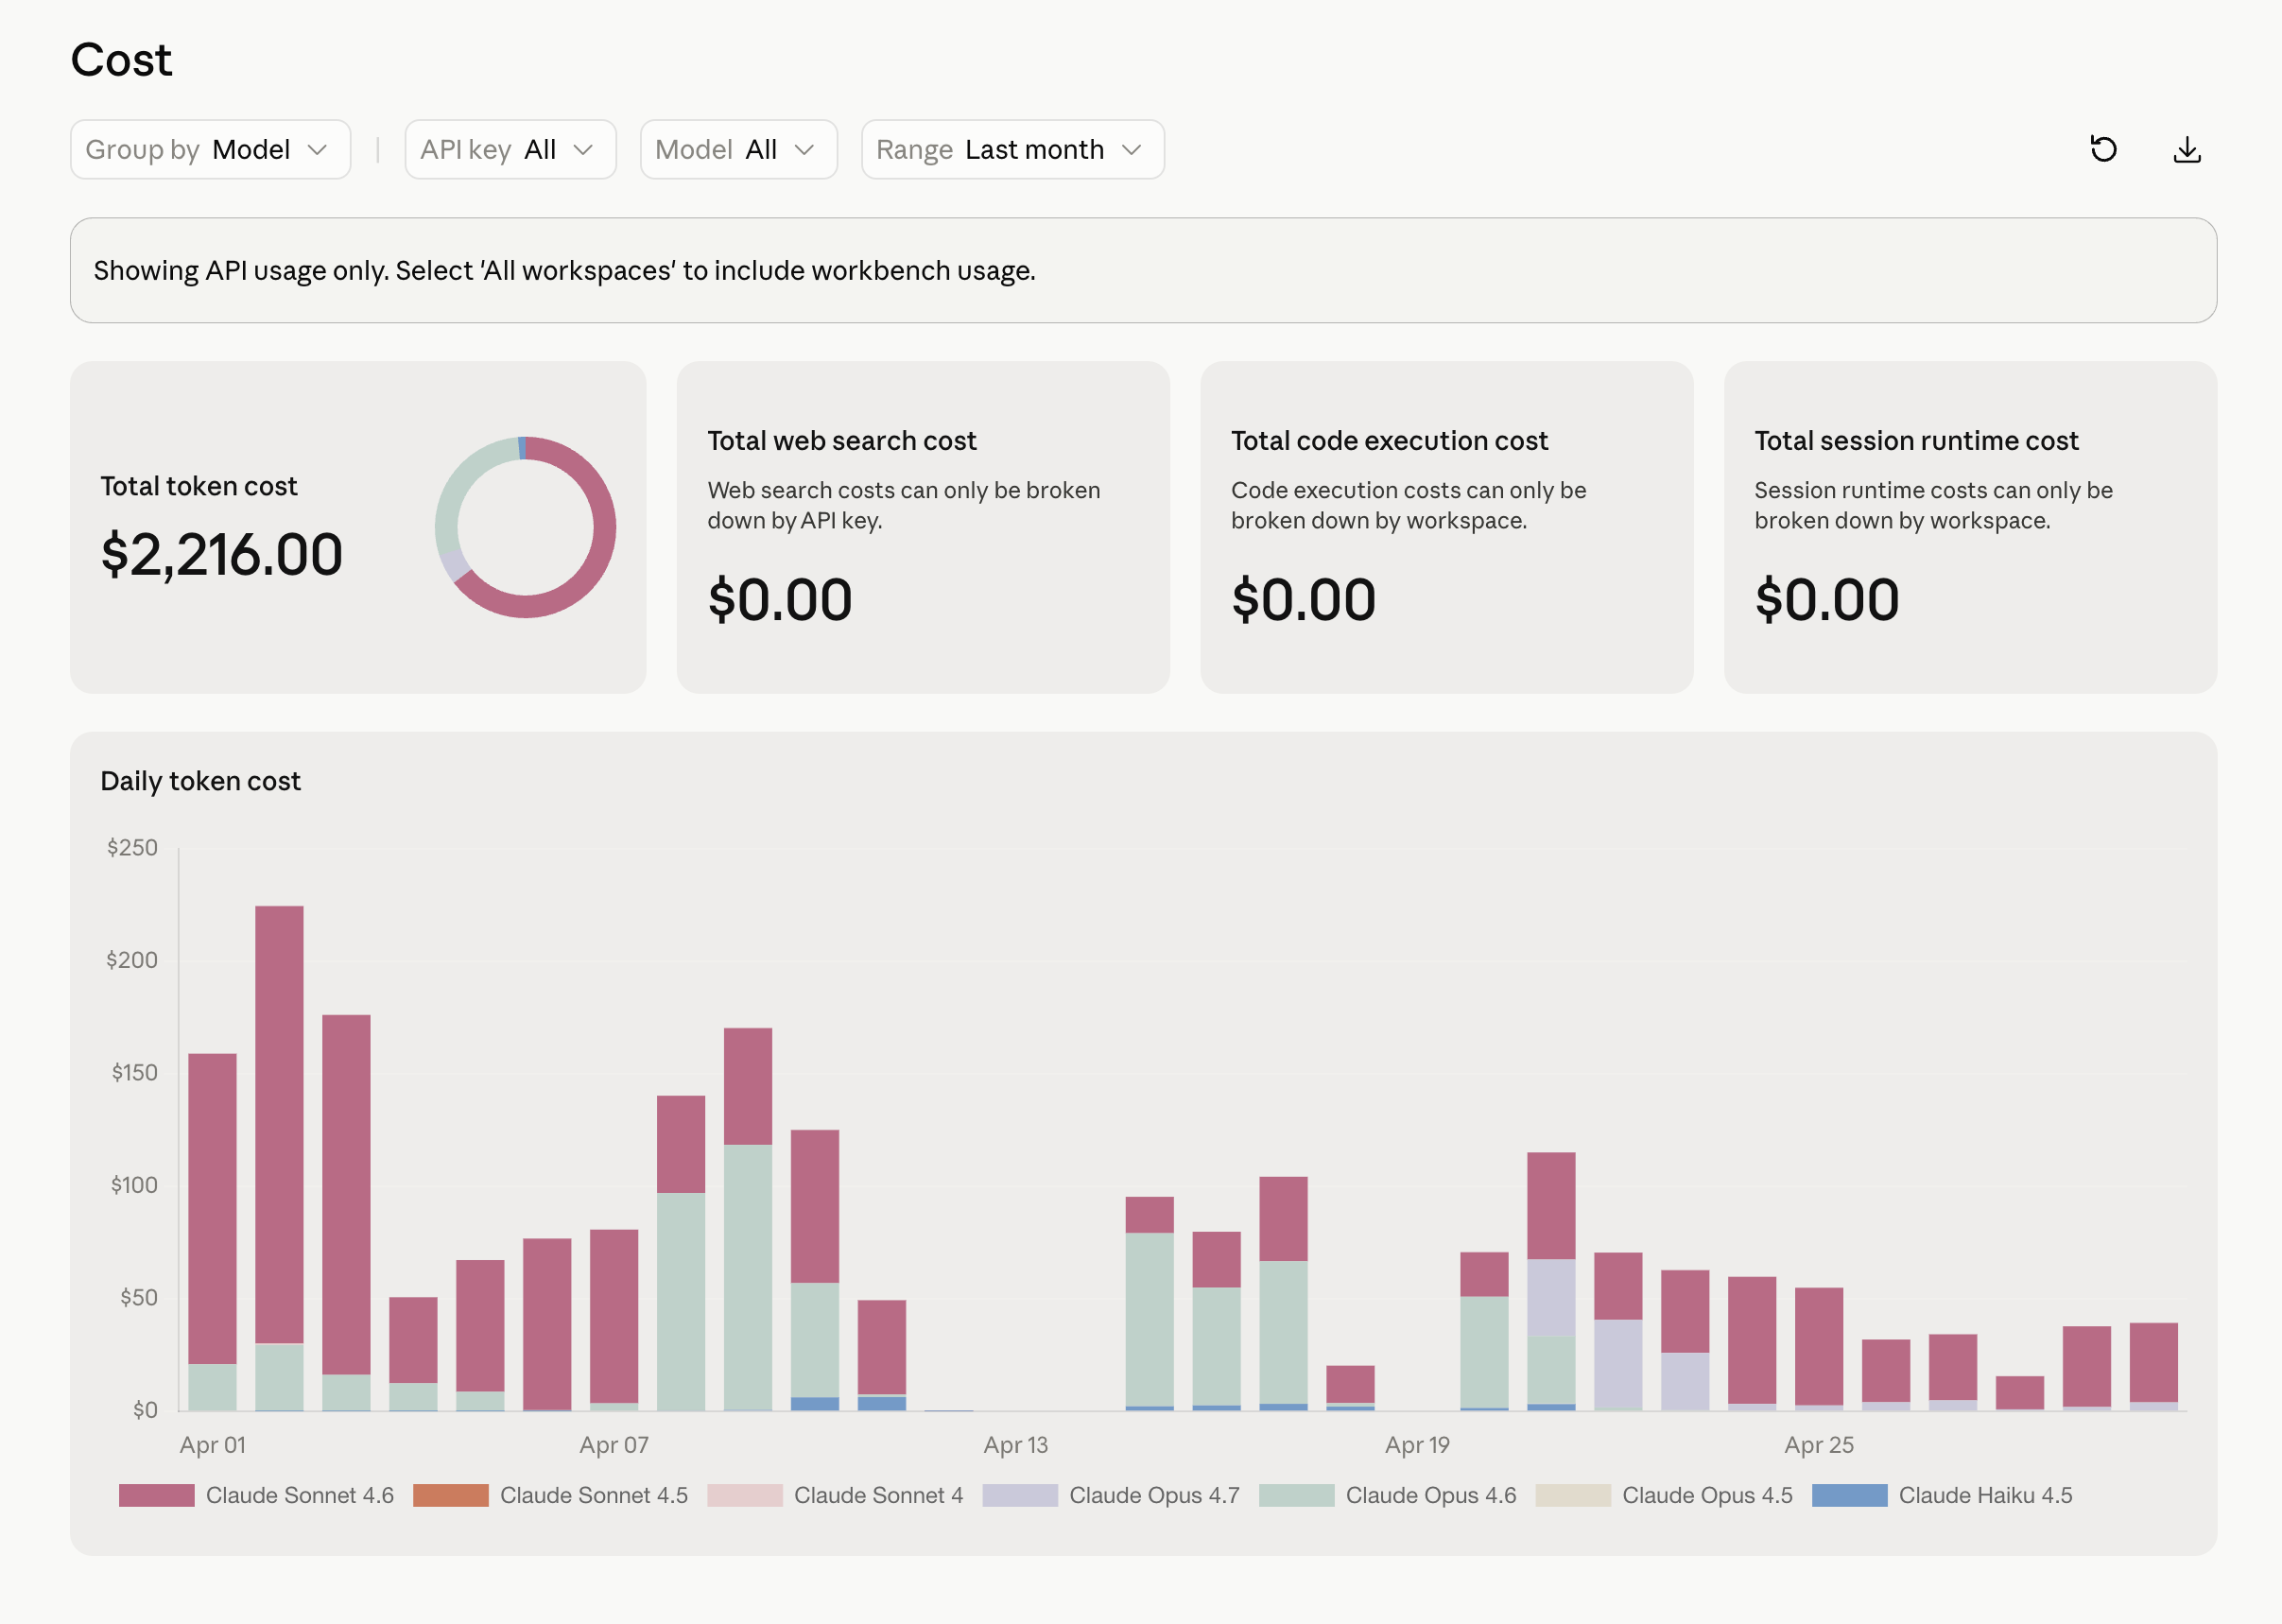
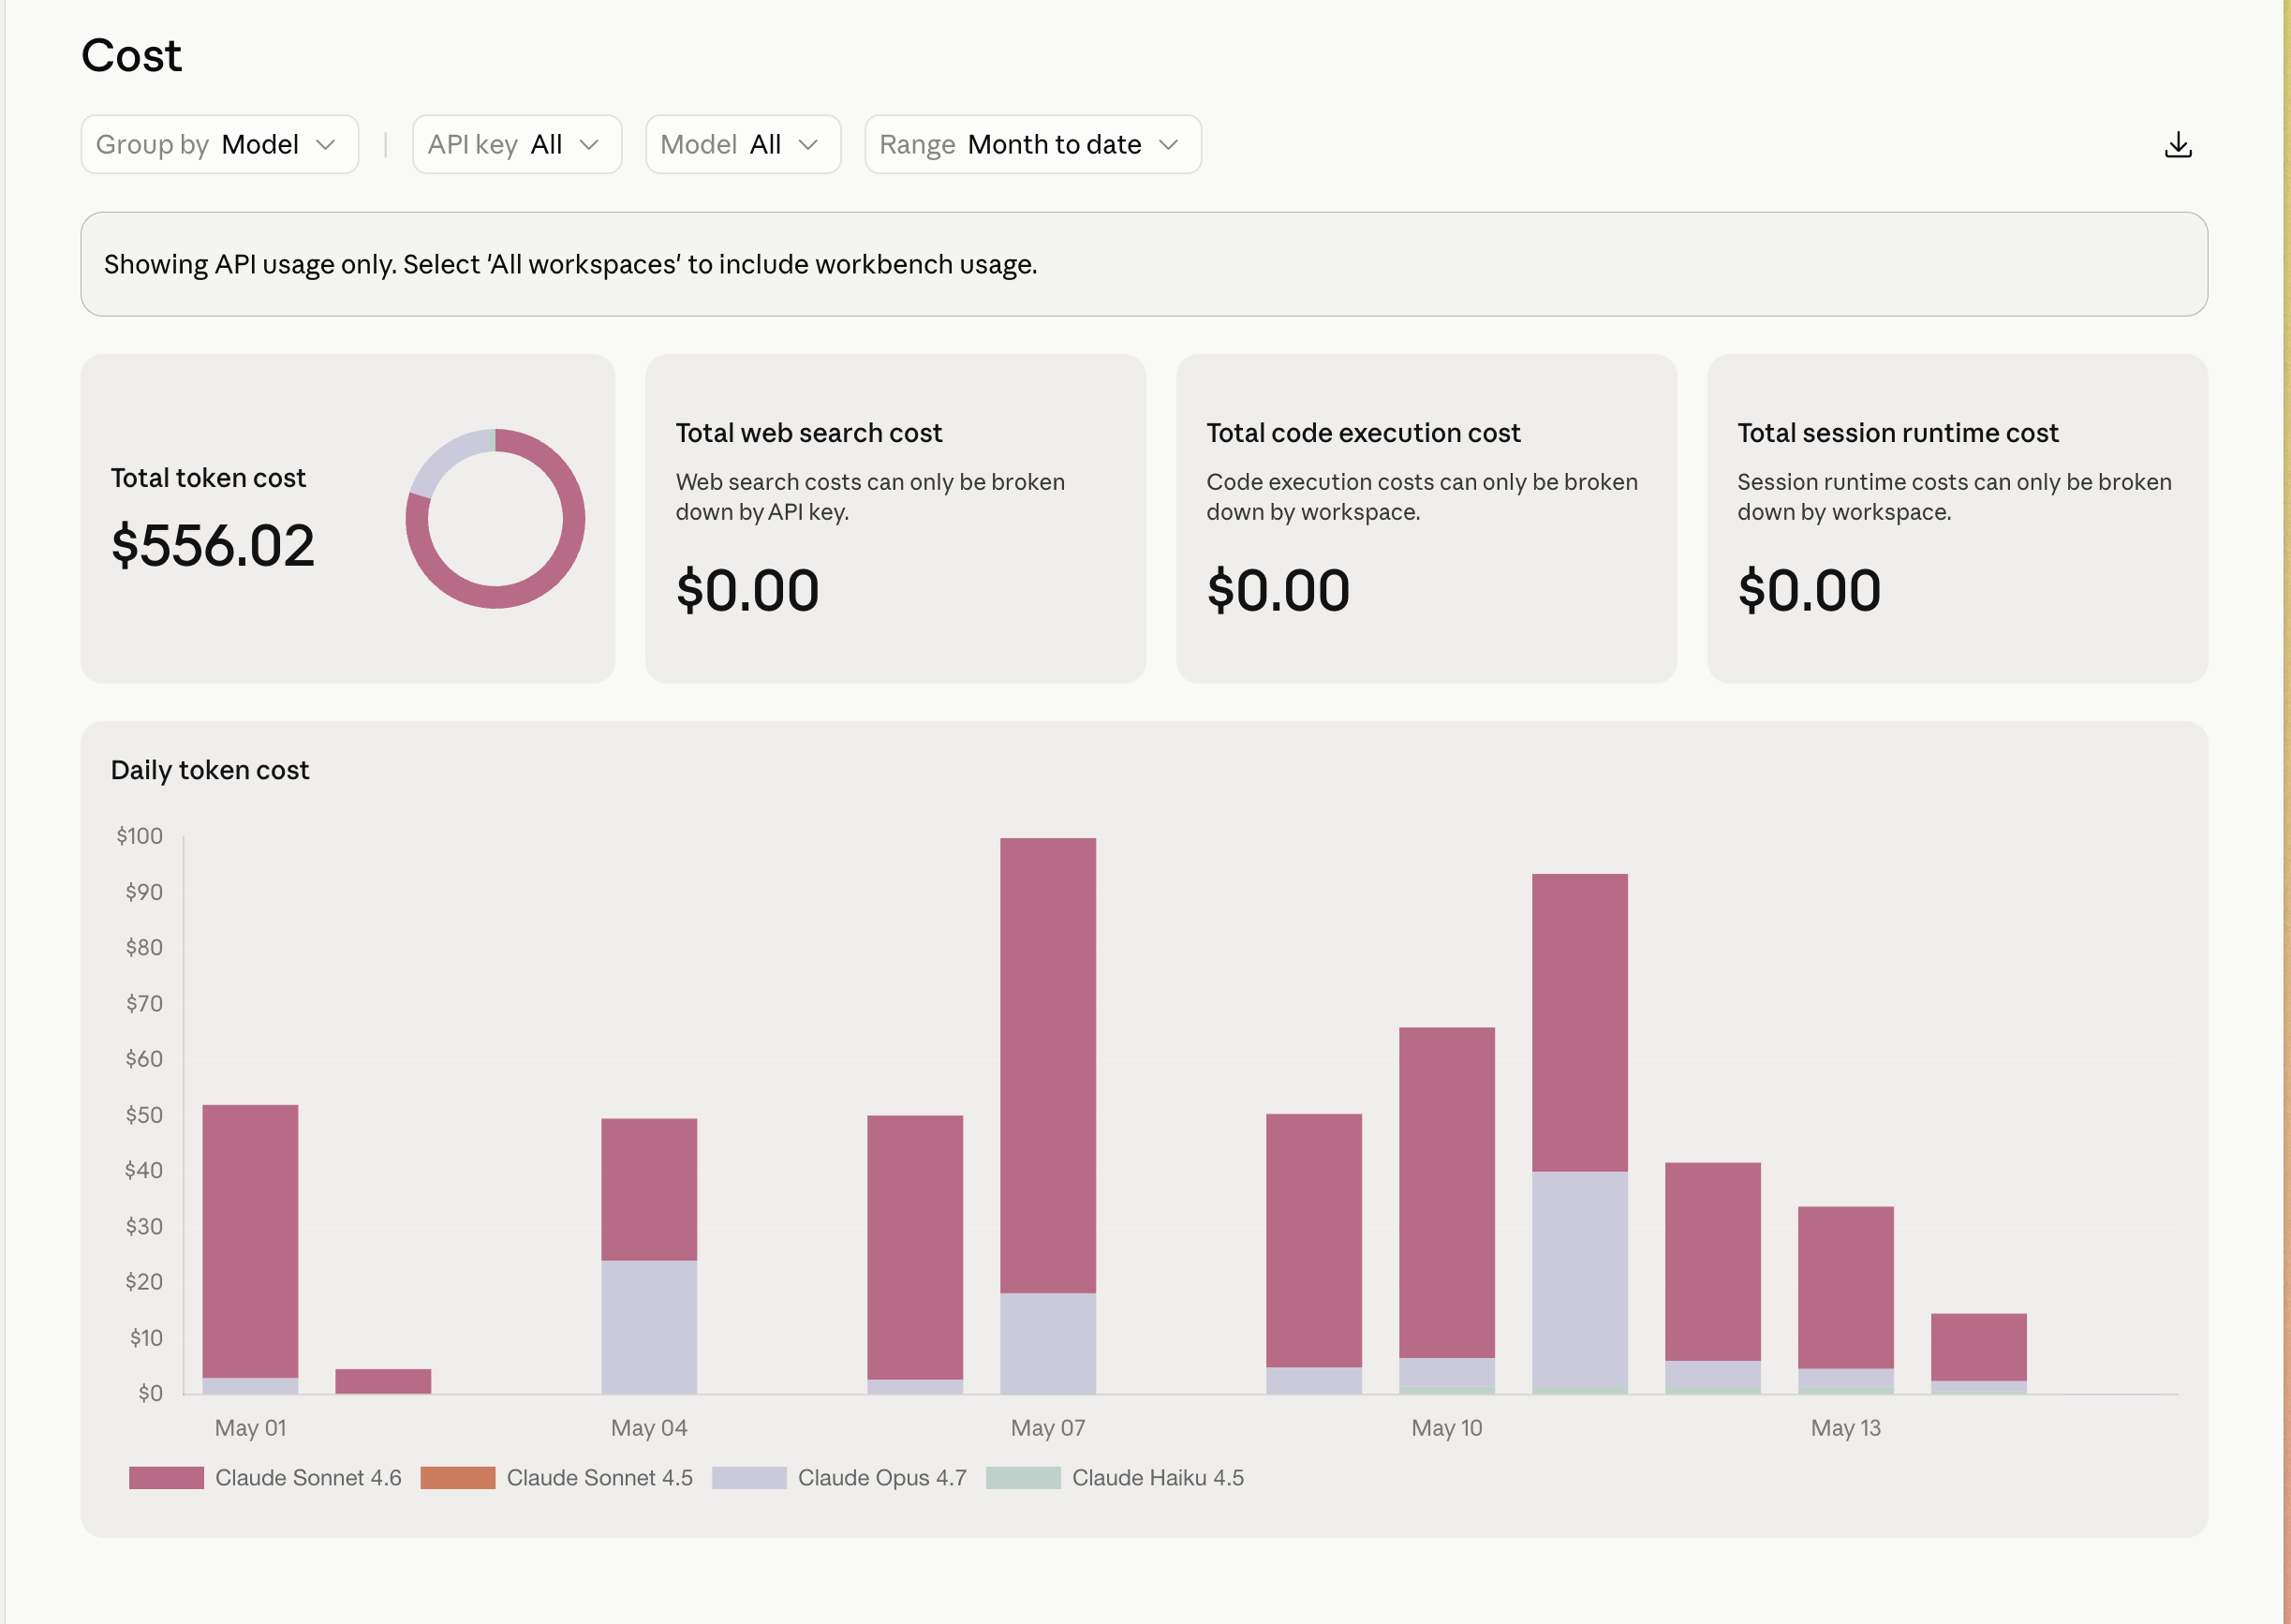
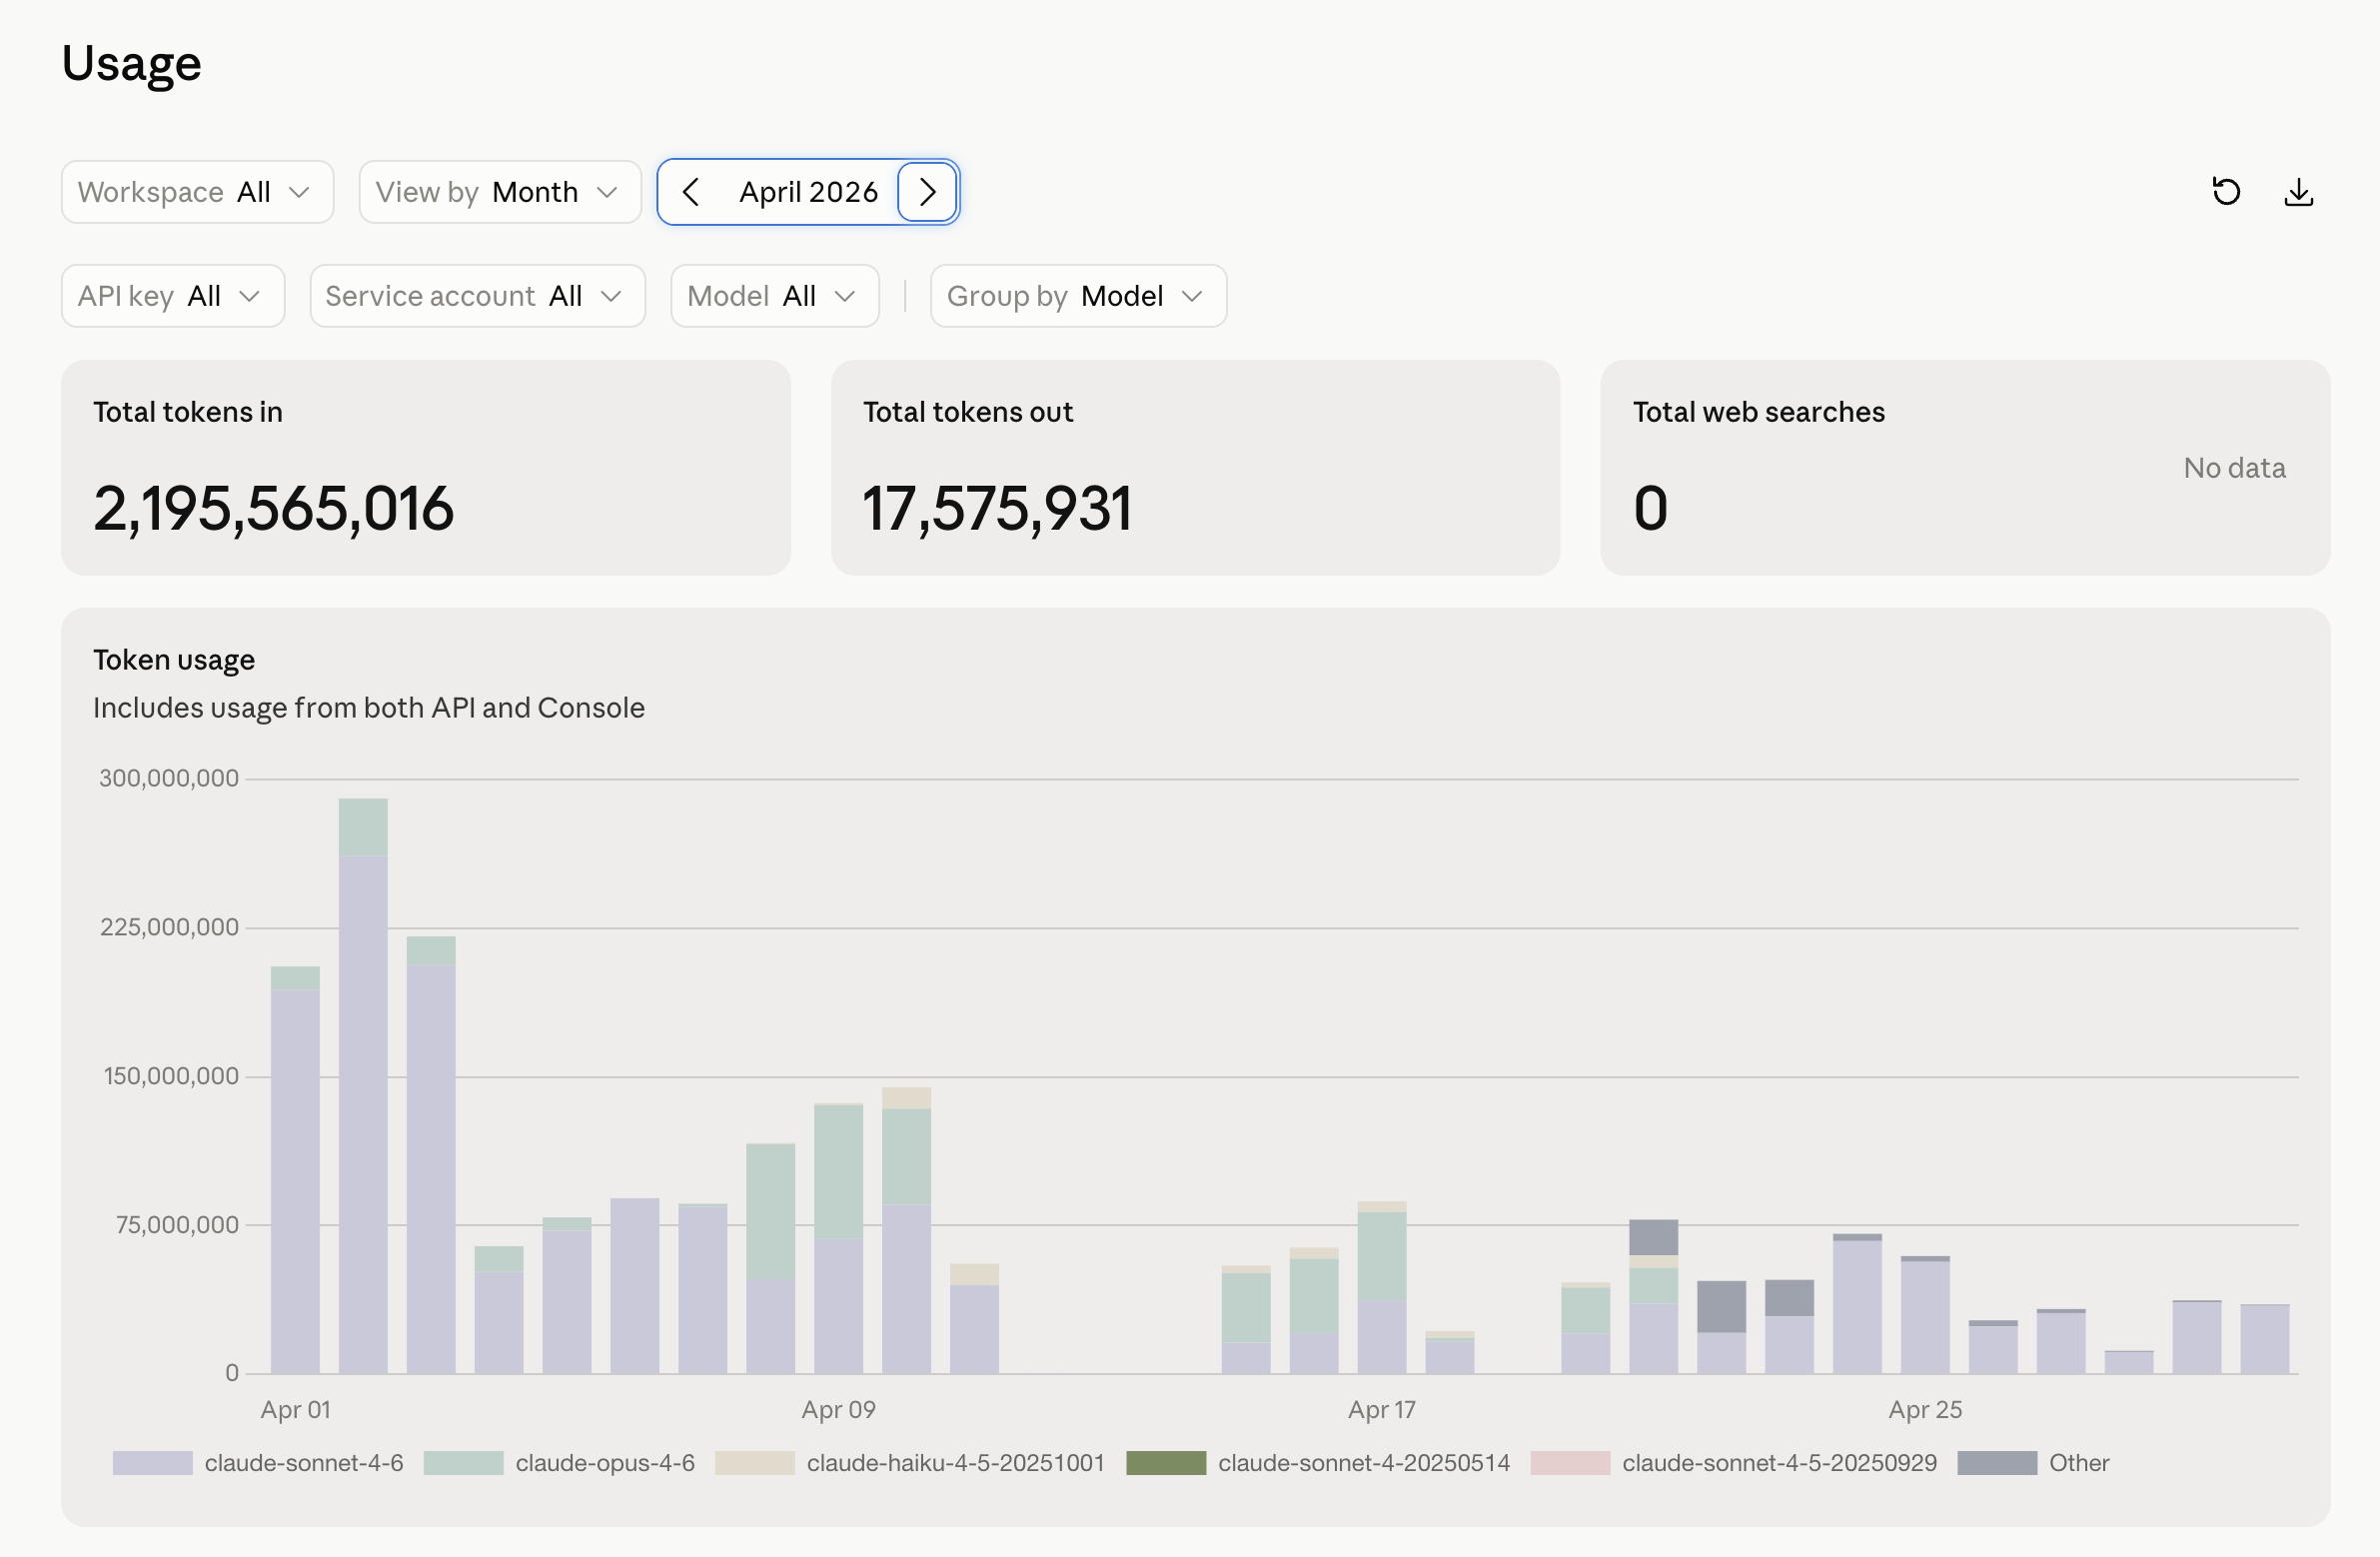
Here is what that scorecard produces on the actual invoice, and this is the proof, not the theory. April direct-API token cost, every model, the whole month: $2,216. The daily bars run ~$220 early in the month and fall to ~$50 by the end — the same optimization arc as the token graphs above, now denominated in dollars. Then May: $556 month-to-date through the 14th — call it a ~$1,200 run-rate against April’s $2,216, the bill itself cut roughly in half with the same class of workload. Web search, code execution, session runtime: $0 in both months, because none of that work needed them. That is the caching receipt in dollars: not “tokens went down,” but “the invoice went down while the work didn’t.” Without the cache, that same workload is a four-figure-per-week number — I know, because I lived one week of it in the cold open.
The discipline is three lines. Open the Caching tab every Monday. If the read ratio cliffs, you voided a prefix — trace it to the commit the way I traced mine in the cold open. If a model’s write amortization sits under ~3× for a week, that cache breakpoint is earning its keep nowhere — consolidate the workload onto it or take the breakpoint out, because you are paying the write premium for a discount you are not collecting.
Batch API — half off if you can wait#
Anthropic’s
Shape of a batch call:
batch = client.messages.batches.create(
    requests=[
        {
            "custom_id": f"summary-{deal_id}",
            "params": {
                "model": "claude-sonnet-4-5",
                "max_tokens": 1024,
                "messages": [
                    {"role": "user", "content": deal_transcript}
                ]
            }
        }
        for deal_id, deal_transcript in deals.items()
    ]
)
You poll the batch ID. When it returns, you pull results by custom_id. I run our weekly newsletter draft generation and the bulk Folderly deliverability eval on this. Together they were a $600/week line item at on-demand rates. They’re $300/week now, and the only thing that changed is that I submit the batch Friday at 5 PM and pull results Saturday morning.
If you can ask “does this need to be done in the next sixty seconds?” and the answer is no — it’s a batch job. Stop paying interactive prices for non-interactive work.
Haiku for triage, Sonnet for default, Opus when you actually need it#
Model routing is the second-biggest lever after caching, and the one most operators get wrong by defaulting to the smartest model for everything.
| Model | Strength | When I use it | $/quality |
|---|---|---|---|
| Haiku | Fast, cheap, decent at well-defined tasks | Classifying inbound email intent. Tagging meeting transcripts. Yes/no triage. Routing decisions. | Highest |
| Sonnet | Default working model. Strong reasoning, tool use, long context. | Morning briefings. Deal summarization. Code reviews on PRs. Skill execution. | Best balance |
| Opus | Hardest reasoning, longest plans, agentic loops with many steps | Architecture decisions. Multi-step | Lowest, justifiable when stakes scale |
The honest curve nobody plots: Haiku is roughly 1/15th the price of Sonnet and gets you 80% of the quality on simple, well-bounded tasks. Sonnet is roughly 1/5th the price of Opus and gets you 90% of Opus’s quality on the working middle of your workload. Using Opus for everything is the AI equivalent of flying first class to the corner store.
The router config I use looks like this:
def pick_model(task_type: str) -> str:
    if task_type in ("triage", "classify", "tag", "extract"):
        return "claude-haiku-4-5"
    if task_type in ("agent_loop", "architecture", "complex_plan"):
        return "claude-opus-4-5"
    return "claude-sonnet-4-5"  # default
Three lines. It cut my bill by roughly 30% the week I shipped it. Not from any one save — from the long tail of triage tasks that no longer ran on the wrong model.
The price of a model is not the price of a task#
Every time a new model lands, the first number everyone quotes is the sticker — dollars per million tokens. It is the wrong number to decide on, and the launch decks are built to make you decide on it.
Concrete, current case: on 2026-05-19 Google announced Gemini 3.5 Flash. The token price tripled — $0.5/$3 → $1.5/$9 per million (3.1 Pro, for reference, is $2/$12 under 200k context). Sticker-shock reaction: “the cheap tier got expensive, skip it.” But it’s a Flash that, on the boards Google showed, clears last-gen Gemini 3.1 Pro on agentic and coding work. A model that one-shots what the previous one needed three turns and a retry to get right is cheaper per task at 3× the per-token price — fewer turns, fewer tool round-trips, no failure-and-retry tax, less of your time reading a wrong answer. The sticker went up; the cost of the task may have gone down. The two numbers are not the same number and nothing on the pricing page tells you which way it broke for your workload.
The only honest way to know is to run it:
# cost-per-task, not cost-per-token. Run YOUR top-5 real tasks
# through old vs new, measure the thing that's actually on the invoice.
for task in top_5_real_workloads:
    old = run(task, model="prev")   # tokens in/out + turns + retries + wall-clock
    new = run(task, model="candidate")
    log(task, old.total_billed, new.total_billed, old.turns, new.turns)
# decide on the total-billed-per-completed-task column. Never on $/Mtok.Three rules that fall out of this:
- Never re-route on a launch-deck number. Vendor benchmarks are a signal that a test is worth running, not a result. Run the loop above on your own traffic before you move a single route.
- A stronger cheap tier resets your whole split. The Haiku/Sonnet/Opus (or cross-vendor) routing table above assumes “cheap tier = weak tier.” The day a Flash clears a last-gen Pro, that assumption is the thing that broke — re-derive the split, don’t patch it.
- Wait for the tier you can’t see. Google promised a 3.5 Pro “next month” at an undisclosed price. Re-tiering on the Flash before the Pro lands is committing on half the board. Note the signal (see Research Notes), hold the routing.
The token budget per skill#
Once your portfolio of (skill_name, input_tokens, output_tokens, cached_tokens, model, ts) to a Postgres table. Once a week I look at the top ten by cost. Some weeks the answer is “morning-briefing is doing what it should.” Some weeks the answer is “competitive-intel-scan is calling Sonnet 60 times in a row when it should be one Sonnet call orchestrating Haiku tool calls.”
You don’t tune what you don’t measure. The Anthropic dashboard tells you the total. It does not tell you which skill burned it. That’s on you.
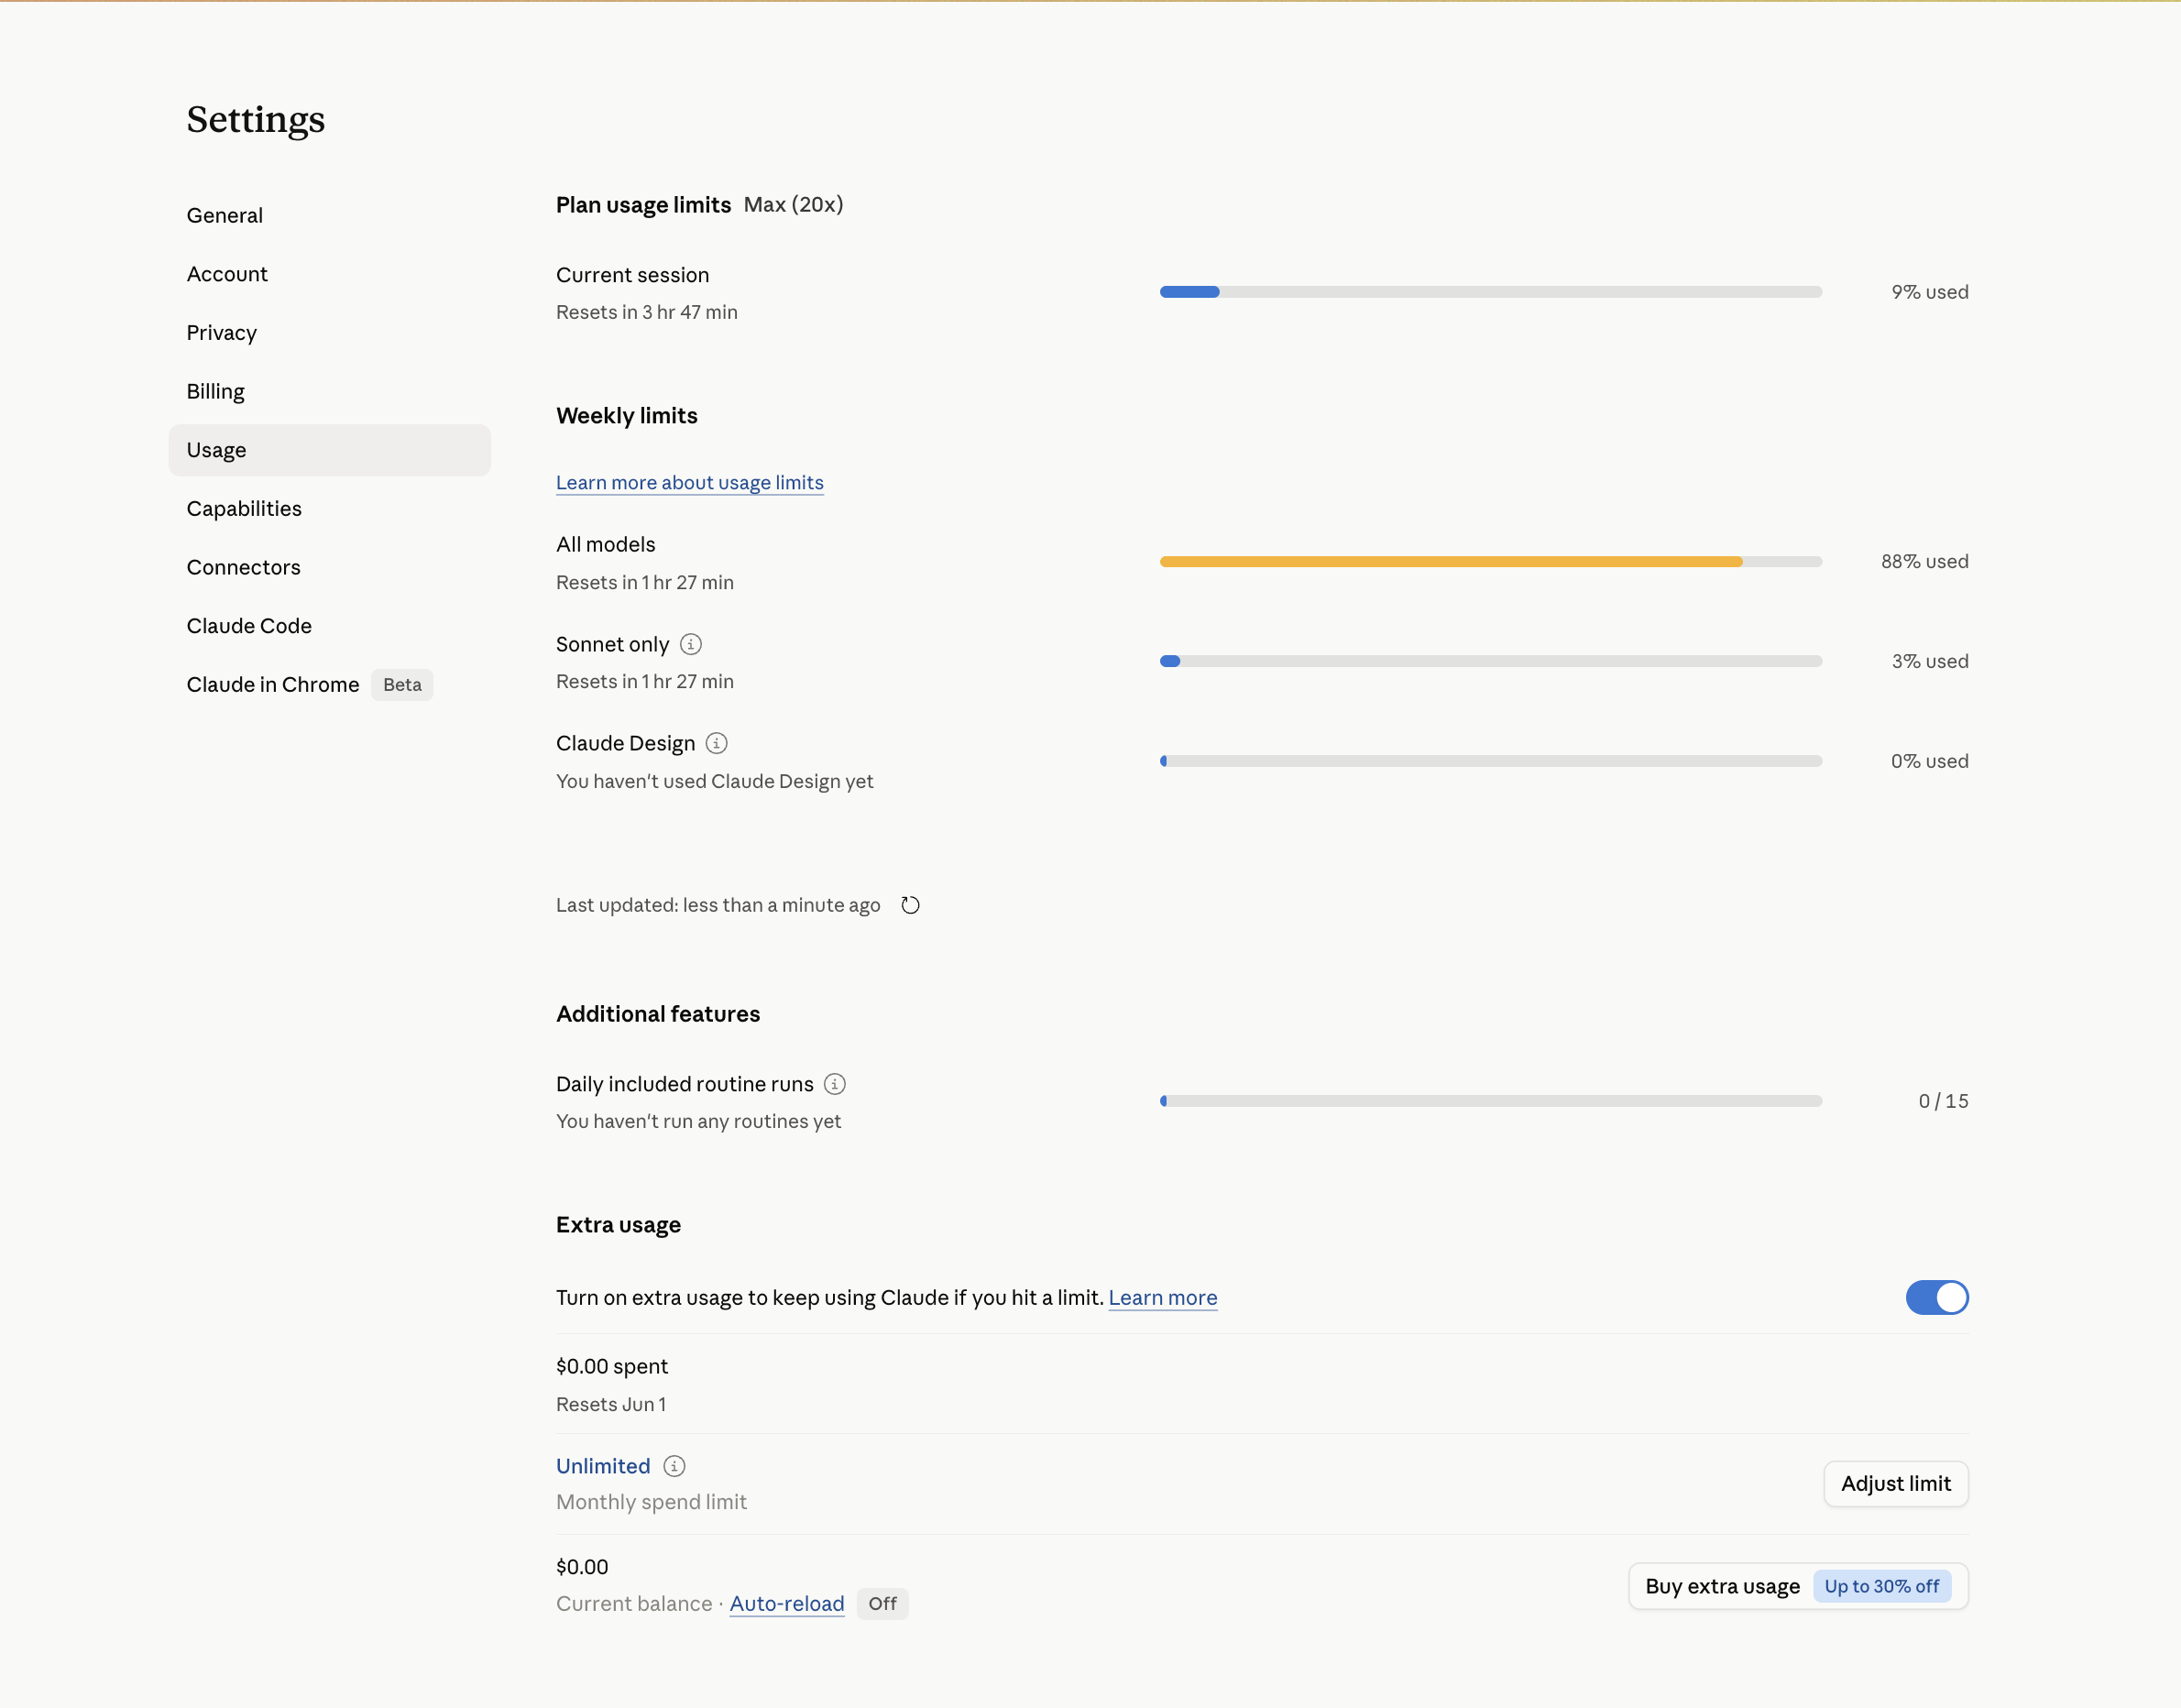
On a subscription instead of the API, the dashboard speaks a different language — not dollars, but percent of a weekly cap. Same discipline, different units. On a Max (20x) plan the number that bites isn’t a bill, it’s the “all models” weekly bar hitting 88% on a Thursday with the heaviest day still ahead. Watch the weekly bar the way you’d watch the API graph: it’s the same question — what’s burning the budget — wearing a different outfit.
Two subscriptions and a shrinking API line#
Here’s the actual cost structure, not a hypothetical. I run two Max (20x) subscriptions — about $400 a month, total — and for where I am right now that is more than enough. The discipline isn’t “spend less,” it’s “max out the thing with the predictable ceiling before you touch the thing with the open meter.” A Max seat has a wall you hit and a price you already know. The API has no wall and a meter that runs as fast as your worst-written agent loop. Push everything you can onto the subscription. The cap is a feature, not a limitation.
The direct API only comes out for the work the subscription can’t do: API integrations, and the autonomous always-on projects — the Rick-style agents that run unattended against the raw API because they need the SDK, not a chat surface (Chapter 30, Chapter 32). That’s a real cost, separate from the $400, and it’s the line I actually optimize.
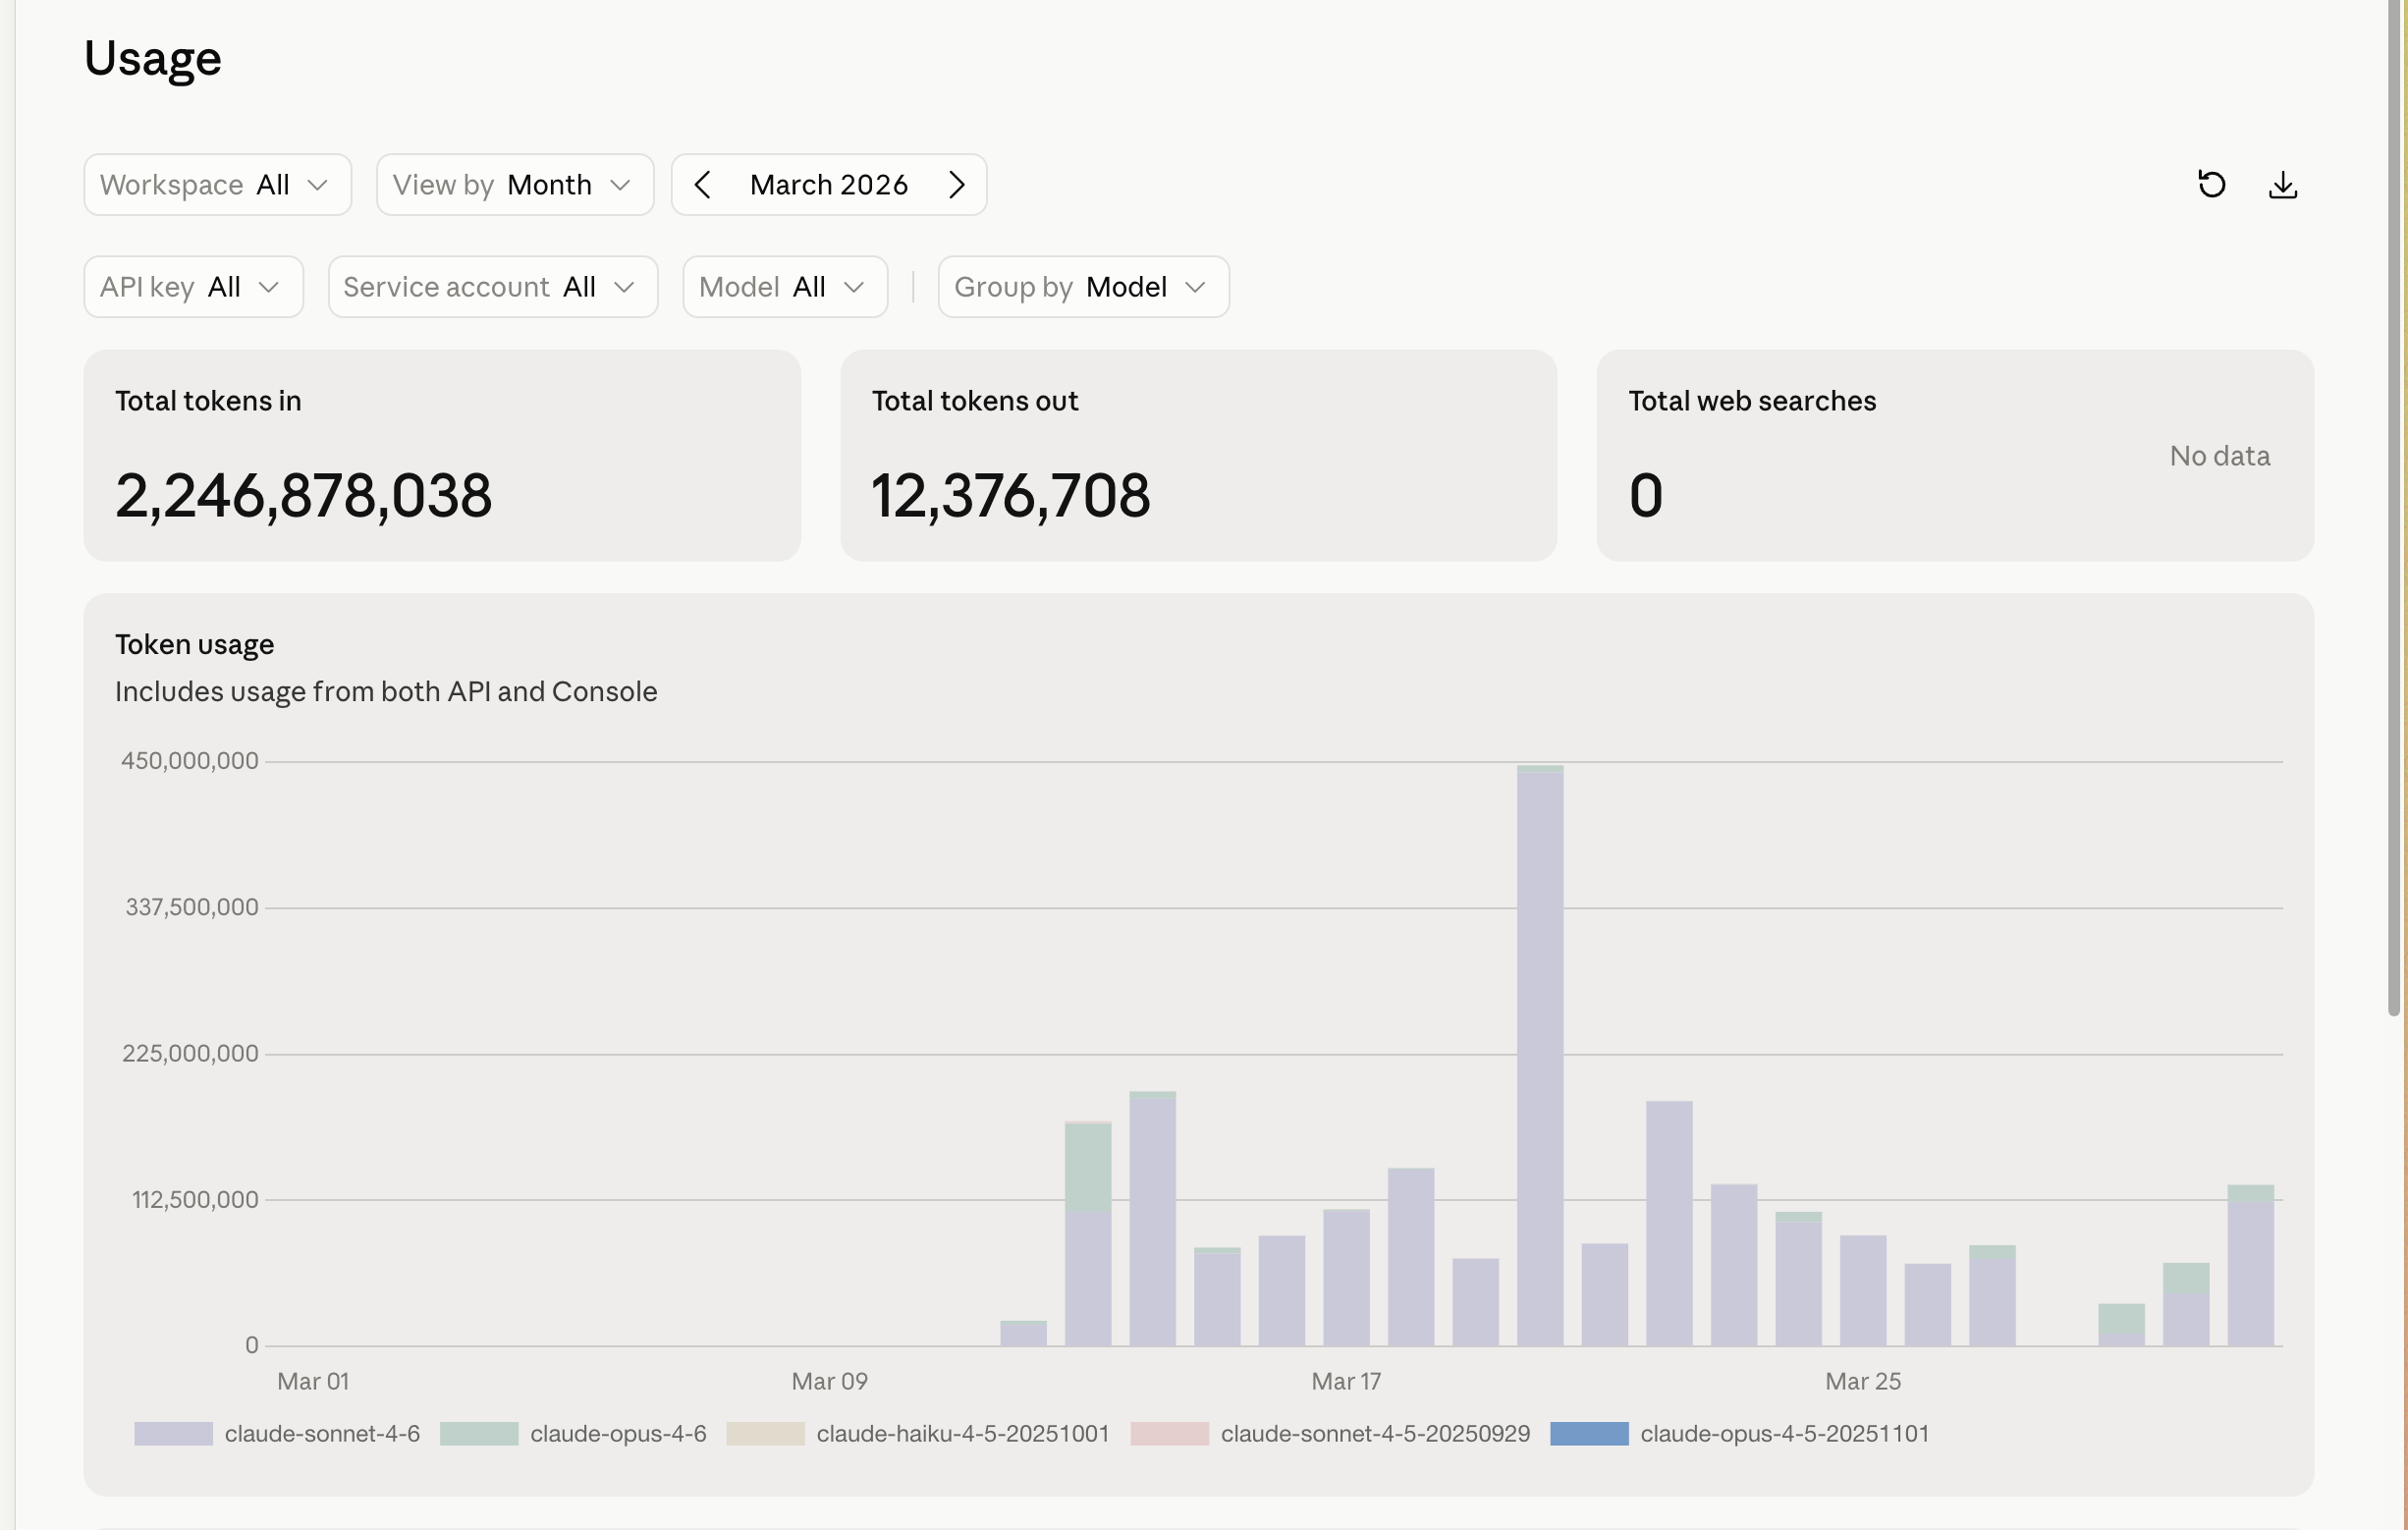
And it has been shrinking. The March graph a few sections up ran ~2.25B tokens in, with one ugly 450M-token day in the middle. April held roughly flat at ~2.2B in — but the spikes started flattening as model routing landed. By mid-May the shape had changed entirely: ~590M tokens in over the first half of the month, no spikes, a flat daily baseline running around a tenth of March’s worst day. Same class of workload. The difference is everything earlier in this chapter, applied — Haiku for triage, stable prefixes for the cache, batch for anything that can wait. The line went down because the discipline went up, not because the work got smaller.
The lesson isn’t the numbers — yours will be different. It’s the structure: a predictable subscription ceiling for the bulk, a ruthlessly optimized API line for the rest, and a monthly look at the graph so a 450M-token day never happens twice without you seeing it coming.
The annual math#
I burn between 3 and 10 billion tokens a month across my stack. At Sonnet pricing with healthy caching, that’s somewhere in the $4,000 to $14,000 a month range depending on the week. Annualized: call it $80K to $150K a year for the entire portfolio.
That number freaks people out until you compare it to what it replaced. Before this stack, the same volume of analytical work — the morning briefings, the Friday wraps, the deal alerts, the mentee prep, the newsletter drafts, the deliverability evals, the competitive scans — was being done by humans I either employed or didn’t have. The lower-bound replacement value is a single mid-level analyst. The honest replacement value is closer to a small team. The bill is a rounding error on what it deletes.
The fact that you’re being charged at all is a feature, not a bug. It means the unit economics of the work are visible, which means they’re tunable. A line item is a thing you can negotiate. A salary is a thing you mostly can’t.
The bill went back to $1,108. I didn’t optimize harder. I just stopped breaking the thing that was already optimized. Most cost wins look like that. You’re not pulling levers. You’re putting the levers back where they were before you fiddled.