A brand-new website, no backlinks, three months old. The operator posts the screenshot: 24,000 clicks. The line on the graph goes up and to the right like a stock you wish you’d bought. The replies are euphoric — agents wrote every page, this is the future of SEO. Then the SEO veterans show up in the comments, unimpressed, and they’re mostly right: a graph you screenshot yourself is not a number anyone can check, and a curve that steep at three months is usually a curve that craters at nine.
I’ve been on both sides of that graph. Over the last year I pointed my own swarm — the one from Chapter 6 — at Google, across two products that were built by AI agents, end to end. One of them worked. One of them produced a graph that looks exactly like a win and isn’t. This chapter is the receipts for both, pulled from Google’s own console and cross-checked against a tool that has no reason to flatter me. No self-reported screenshots. The numbers that survive someone trying to disprove them.
The graph that craters#
Most “agentic
But here’s where I split from the cynics. The problem was never that an agent wrote the pages. That’s a reflex, not an argument. The problem is what the agent wrote and whether anyone can independently check the result. Google doesn’t grade your production method.
Generation was never the bottleneck#
So invert the whole frame. Agents are cheap labor. The swarm can produce ten thousand pages before lunch. That’s precisely why generation can’t be your moat — if you can do it for free, so can everyone, and Google knows it. The scarce resource is the right to publish, not the ability to generate.
The durable-versus-churn line is one sentence: per-page data uniqueness plus real intent, not the agent stack. A page that contains differentiated data — a live result, a computed score, a generated artifact — earns the right to exist. A page that paraphrases what a million other pages already say is inventory waiting to be deduplicated.
Which sets up the two products as a natural experiment. EmailGen’s pages each carry differentiated data: a live spam score, a generated email. LinguaLive’s pages are closer to generic language content — facts anyone can restate. Same swarm, same build quality. If the thesis is right, the numbers should split along exactly that seam. They did.
What I actually pointed at Google#
The recipe is boring on purpose. Two products built by AI agents end to end. Free
And the honesty stake, planted before any good number lands: this is early. EmailGen has roughly a year of data. LinguaLive has about 6.5 months. This is not a twelve-months-survived, revenue-proven case. I’ll tell you exactly what’s measured and what isn’t, because the asterisks are the most credible thing in the chapter.
EmailGen: a real win on commercial intent#
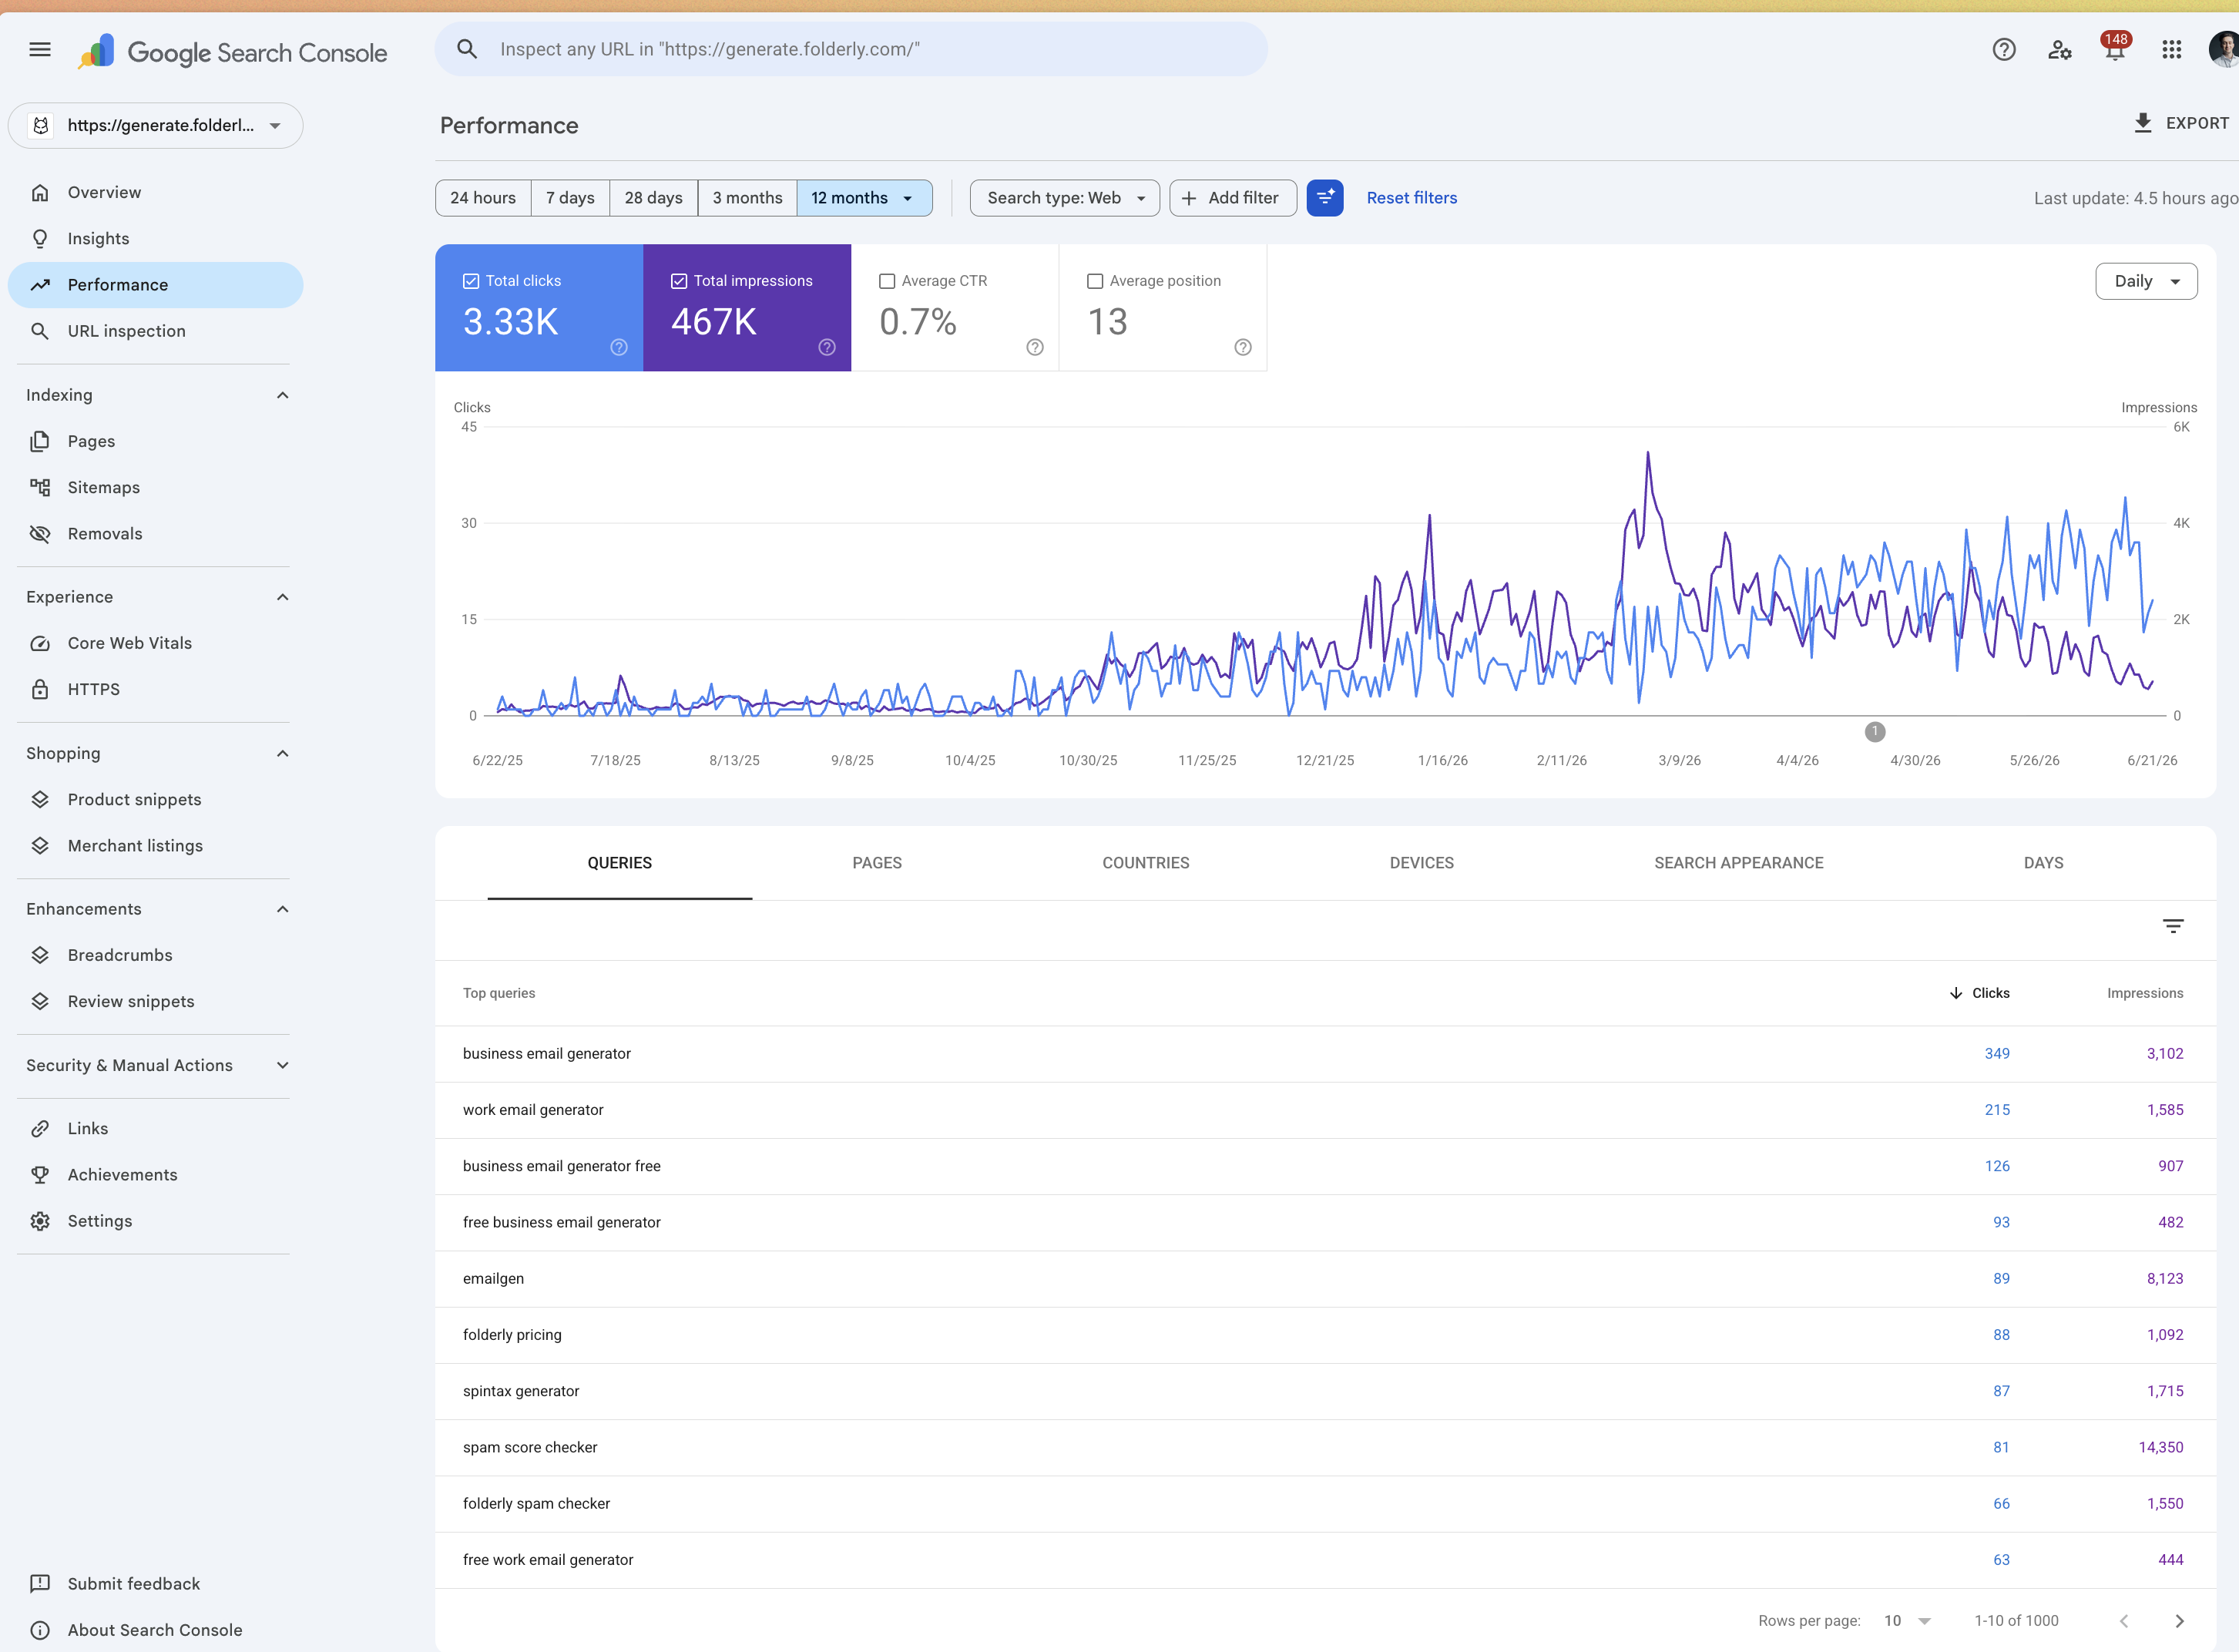
EmailGen lives on generate.folderly.com — a brand-new subdomain, built by agents to ship free email and spam tools as programmatic lead-gen for Folderly. No history on that subdomain. No backlink campaign. No PR, no launch. Every page built by agents, not one written by a human. Twelve months of Google Search Console (Web, all countries):
- 3,330 clicks
- 467,000 impressions
- 0.7% average CTR
- average position 13
- impressions ramping clearly in the second half — a growth curve, not a flat line
- GSC reports ~1,000 query rows — a new subdomain ranking for roughly a thousand queries inside a year is the footprint that matters
The win is sharpest on commercial intent, and the independently-checkable part comes from Ahrefs (third-party, pulled 2026-06-23, subdomains, worldwide), which has no incentive to flatter me. It ranks EmailGen #1 for “business email generator” (volume 100, KD 36), and top-3/top-4 for three more buyer-intent tool queries: “business email generator free” (KD 50, position 2), “work email generator” (KD 63, position 2), “company email generator” (KD 63, position 4). A brand-new subdomain at the top of a KD-36 buyer query, confirmed by a tool I don’t control — that’s the receipt the Reddit screenshot can never be.
Now read the caveats in the same breath, because they’re load-bearing. A 0.7% CTR and an average position of 13 mean exactly what they say: a lot of this is page-2 ranking and zero-click impressions. Position 13 is the top of page two on most layouts — you don’t get clicked from there, you get counted. And the impression count flatters the truth. “Spam score checker” pulled 14,350 impressions for 81 clicks — the single biggest non-branded impression line in the set, and a 0.56% CTR. Compare “business email generator”: 3,102 impressions, 349 clicks — a quarter the impressions, four times the clicks. The query that prints the most impressions is the one earning the least. And “emailgen” (8,123 impressions, 89 clicks) is branded — people already looking for the tool.
The independent traffic value tells the durable story best. Ahrefs’ monthly traffic-value history over the last 13 months, in dollars: $290–390/mo** band. Estimated organic traffic moves the same way: 0.14, 8.48, 13.54, 6.91, 9.34, 268.60, 92.23, 55.86, 134.07, 91.44, 286.99, 388.27, 318.11. A clean step-change around month six — single-digit dollars to a couple hundred — settling in the **1, 10, 16, 15, 16, 330, 132, 95, 223, 90, 151, 179, 144. Current snapshot: 21 organic keywords, 8 in the top 3, ~136 visits/mo, ~$312/mo traffic value. That step-change is the tell. Generic content decays after the honeymoon. Differentiated utility holds — though one good year is a plateau, not yet proof of a trend.
What’s not proven: this is ~1 year old, there’s no conversions-to-revenue cohort, and no AI-citation share. The win is discovery footprint plus independent commercial ranking — not dollars in the bank. That next layer lives in Chapter 47.
LinguaLive: the graph that lies#
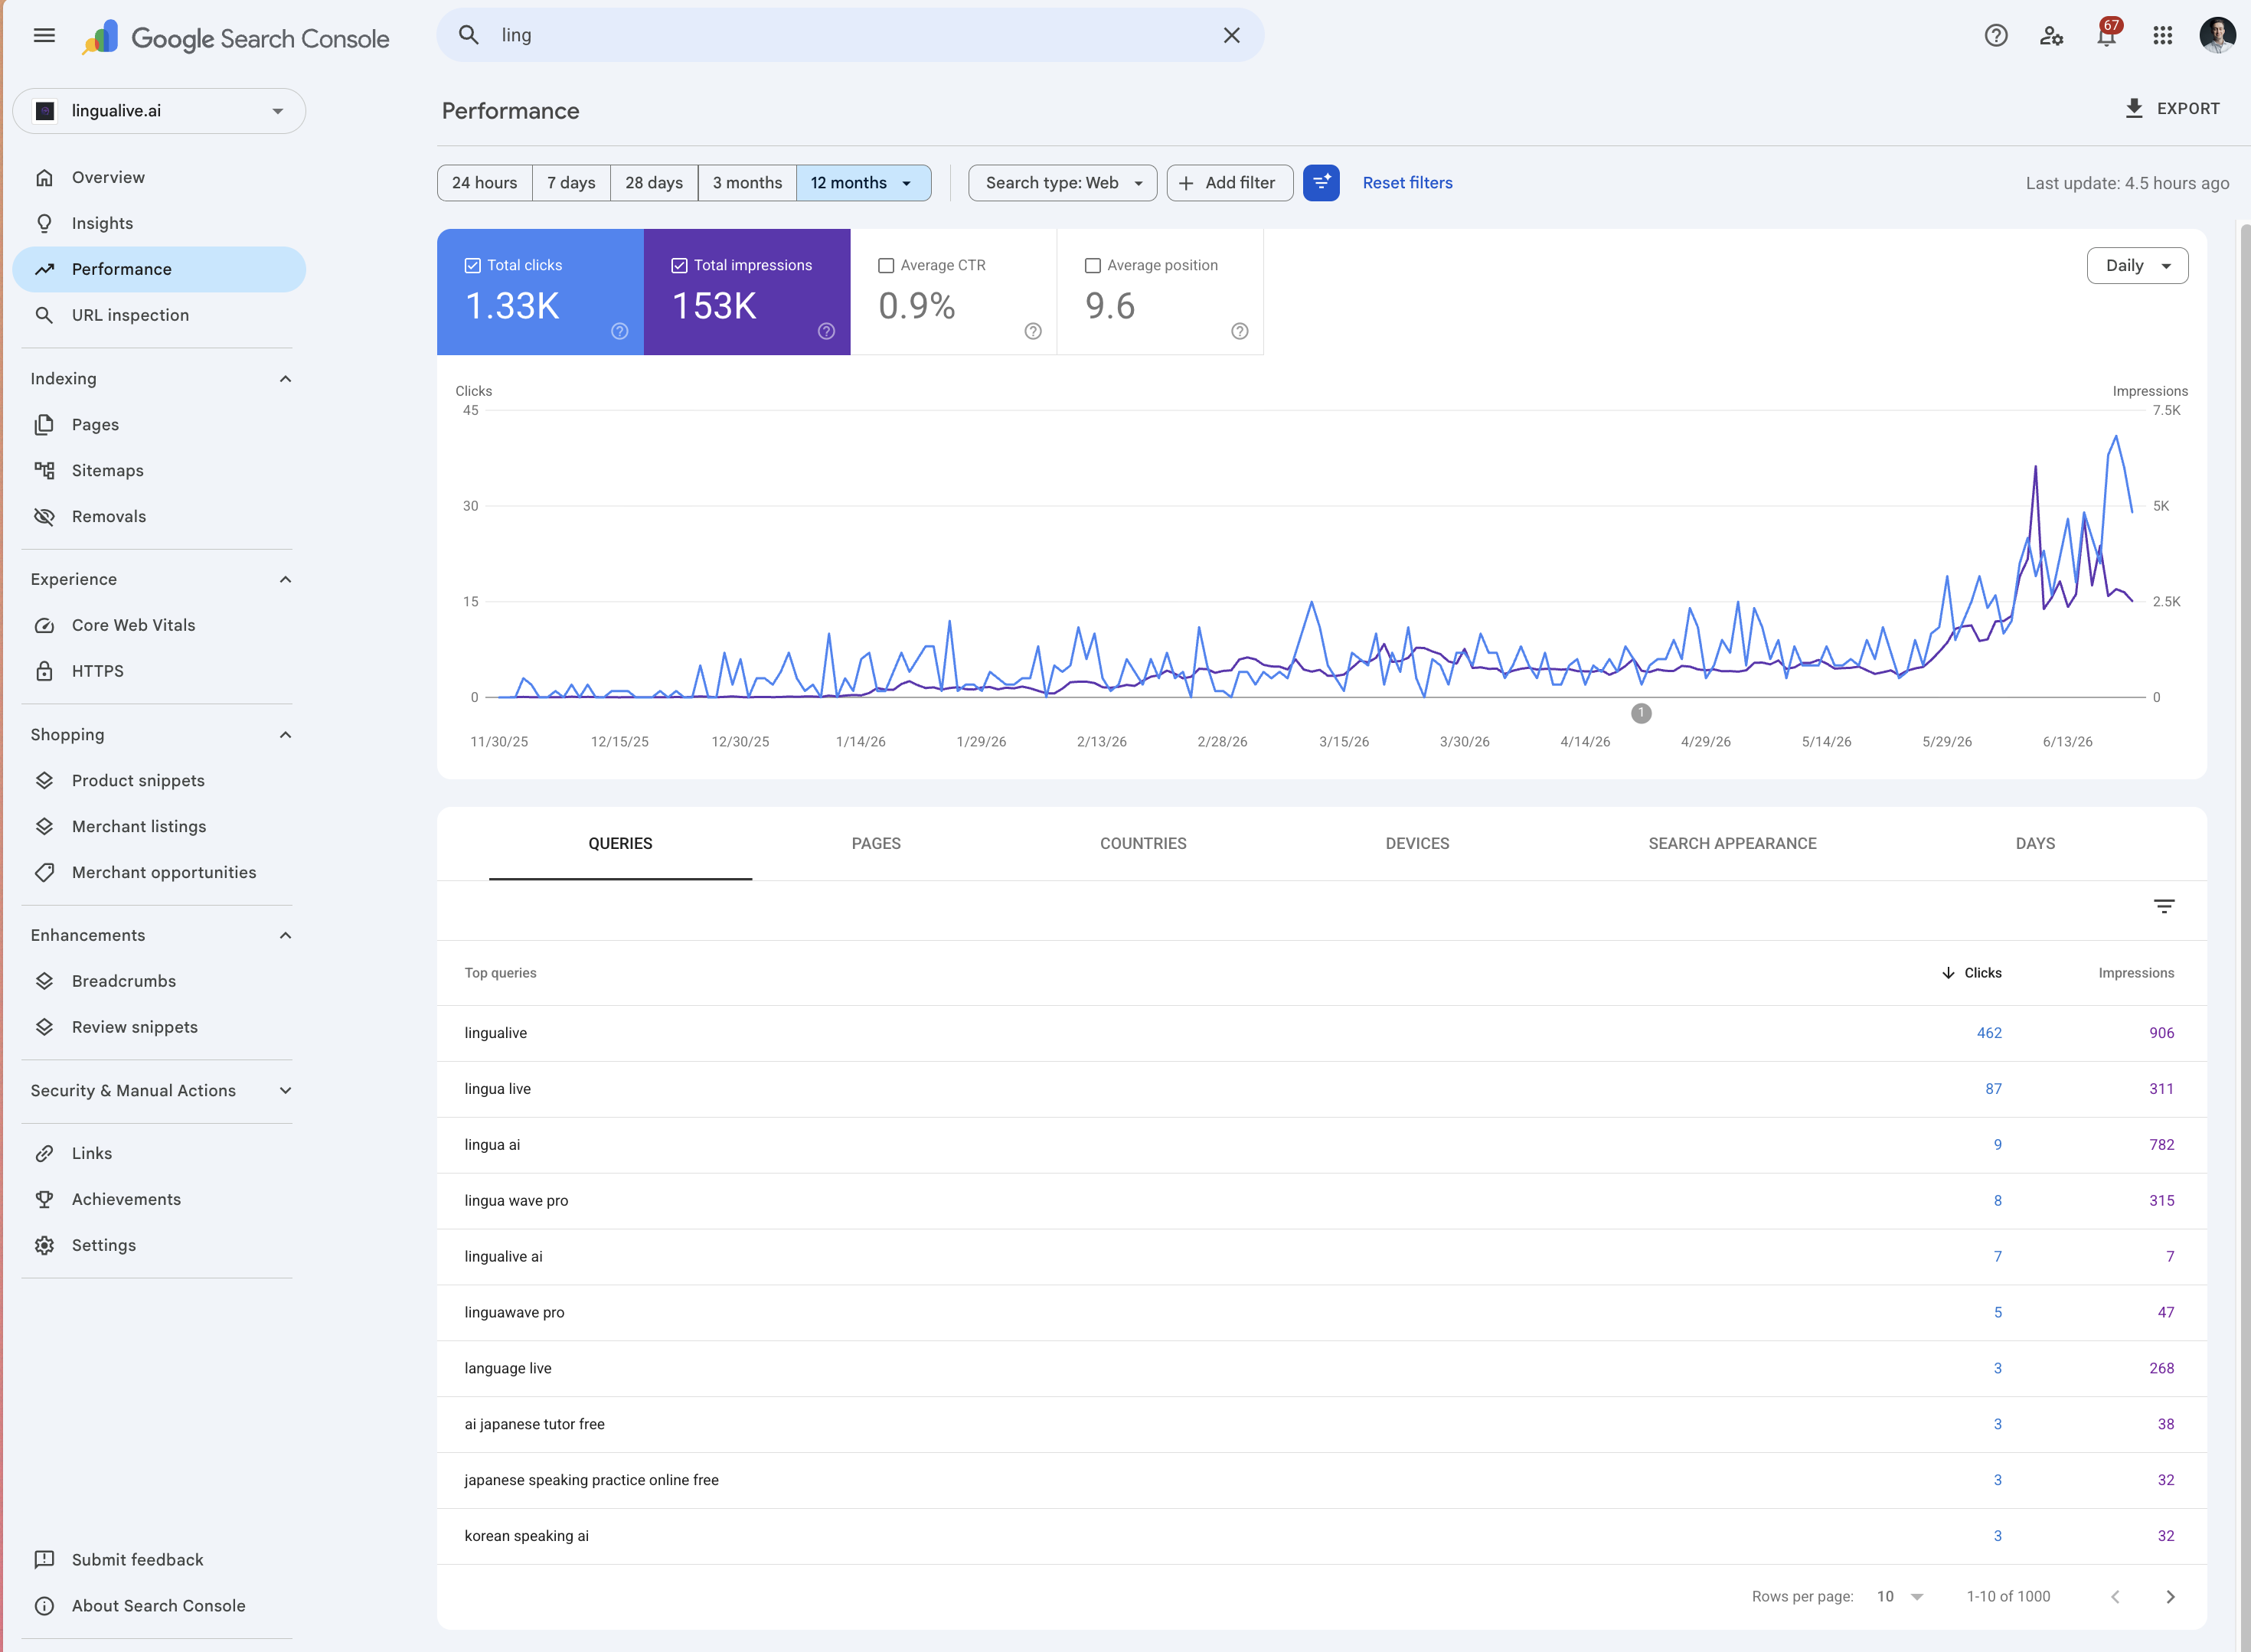
LinguaLive (lingualive.ai) is the AI language tutor — the same example product from Chapter 47. On paper its GSC graph looks better than EmailGen’s: a higher CTR, a better average position, a clean upward curve. That’s exactly why it’s the warning. Twelve-month window, but the data effectively starts ~2025-11-30 — so about 6.5 months live:
- 1,330 clicks
- 153,000 impressions
- 0.9% average CTR
- average position 9.6
A 153K-impression graph with a better CTR and a better position than the product that’s actually winning. Looks like a win. Now read the top queries (clicks / impressions): lingualive 462 / 906, lingua live 87 / 311, lingua ai 9 / 782, lingua wave pro 8 / 815, lingualive ai 7 / 7, language live 3 / 268, ai japanese tutor free 3 / 38, korean speaking ai 3 / 32.
The branded math (derived). Add the clearly-branded rows — lingualive 462 + lingua live 87 + lingualive ai 7 = 556 branded clicks. The visible top-query set sums to roughly 590 clicks. By my count that works out to ~556 of ~590, about 94% branded — derived from the top-query rows, not a field GSC reports. People who already knew the name typed it in. That isn’t discovery. That’s a brand reading its own name back.
Strip the brand and the long-tail collapses. lingua ai — 782 impressions, 9 clicks. lingua wave pro — 815 impressions, 8 clicks. language live — 268 impressions, 3 clicks. The actual language-learning queries — the ones that would mean discovery — earn roughly three clicks each despite real impressions.
The independent check makes it worse, honestly. Ahrefs: 70 organic keywords, 17 in the top 3 — but only ~27 visits/mo and ~$12/mo of traffic value. It ranks for big language terms and ranks poorly: “i love you in spanish” (volume 11,000, position 30), “spanish ai” (volume 2,400, position 39), “ai tutor” (volume 500–700, position 17–21), “how to say hello in spanish” (volume 900, position 19). The highest-intent terms a tutor could want — the competitor-alternative plays — rank low and pull near-zero traffic: “duolingo max alternative” position 25, “italki alternative” position 10, “memrise alternative” position 12. Ahrefs’ traffic-value history: 0, 0, 0, 0.80, 0.69, 1.52, 8.45. Organic traffic: 0, 0, 0, 2, 3, 4, 21.
First-party lies one way, third-party lies the other#
Here’s the centerpiece — the disagreement the whole method hangs on. Both numbers are “true.” They diverge massively. EmailGen: Google’s own console says ~1,000 queries and 3,330 clicks in a year; Ahrefs sees 21 keywords and ~136 visits/mo. Annualize the Ahrefs figure — 136 × 12 ≈ 1,632 (derived) — and the third party sees roughly half the clicks Google reports, across one-fiftieth the query surface. LinguaLive runs the same way: GSC 1.33K/yr versus Ahrefs ~27/mo, 70 keywords.
That gap is not an error. It’s the nature of long-tail agentic SEO — a thousand tiny queries each sending a trickle, most of them below the volume threshold a third-party crawler even bothers to index. Third-party tools massively undercount the long-tail. Judge an agentic-SEO build by Ahrefs alone and you’ll conclude almost nothing happened, when GSC shows a thousand-query footprint.
But the inverse trap is worse, and it’s the whole reason I don’t lead with the GSC graph. A self-reported GSC screenshot can’t be independently verified. It’s my console — you have to take my word that the curve is real and the traffic is human. That’s precisely the move the vanity operators make: the Reddit guy flashing 24k clicks on a zero-backlink site, a number nobody outside his login can check. Neither tool is trustworthy alone. So you triangulate, and each leg checks a different failure mode: GSC for footprint and real clicks (the thing third parties can’t see), Ahrefs for the independently-checkable commercial keywords and a dollar traffic value (the thing self-reports can’t prove), and conversions/revenue per source cohort for truth (the thing neither tool measures). It’s the same “measure it before you believe it” instinct as Chapter 47, one altitude up. EmailGen survives both legs that exist today; the third — revenue — isn’t built yet. LinguaLive passes the GSC eye-test and fails the moment you cross-check.
What actually lasts#
Distill it to a method, not a checklist wall.
The one-line keeper: build pages that are differentiated data with real intent behind the query, gate publishing hard, and the agent stack becomes an implementation detail. EmailGen’s spam checker is data. LinguaLive’s “hello in Spanish” is trivia. The dataset decided the outcome.
What I can’t show you yet#
This is the most credible move in the chapter, so I won’t soften it. These are early — about a year for EmailGen, 6.5 months for LinguaLive. Not a twelve-months-survived, revenue-proven case. EmailGen’s curve could still flatten or crater; one good year is not durability, and I’ll tell you the day it becomes one, with the numbers, the same way I’m telling you this.
Two things are explicitly unmeasured. First, AI-citation share — I can’t tell you what percentage of ChatGPT or AI Overview answers about “business email generator” name Folderly, and that’s where zero-click traffic actually goes. Second, conversions-to-revenue per cohort — the only number that turns “ranks #1” into “made money.” Both belong to the measurement layer in Chapter 47, and that instrument has to answer them before any of this is a proven win.
One last honest thing: this chapter is itself a test. If the argument is right — that citations go to pages a model can quote, not pages stuffed with the right words — then this page should earn its own the same way: named products, real first-party numbers (467K impressions and 3.3K clicks for EmailGen; ~94% branded clicks for LinguaLive), a third-party check that contradicts the self-report, and one claim sharp enough to lift whole — impressions aren’t discovery, and discovery isn’t value. No keyword density, no padding. If an answer engine ever quotes this page, I’ll know which sentence it took, and I’ll know why. I haven’t measured the result yet. That’s Chapter 47’s job, not mine.
The closer#
One real win. One honest failure, kept in on purpose. Both checked two ways, because a number I can’t independently verify is a claim, and a number a third party undercounts is half a story. The skill was never pointing the swarm at Google — anyone can do that by Tuesday. The skill is knowing which of the two graphs to trust.
One graph went up because the work was real. One went up because the brand was already known. The only skill in agentic SEO is telling them apart before you believe either one.